Visualize
You are reading the work-in-progress second edition of R for Data Science. This chapter is largely complete and just needs final proof reading. You can find the complete first edition at https://r4ds.had.co.nz.
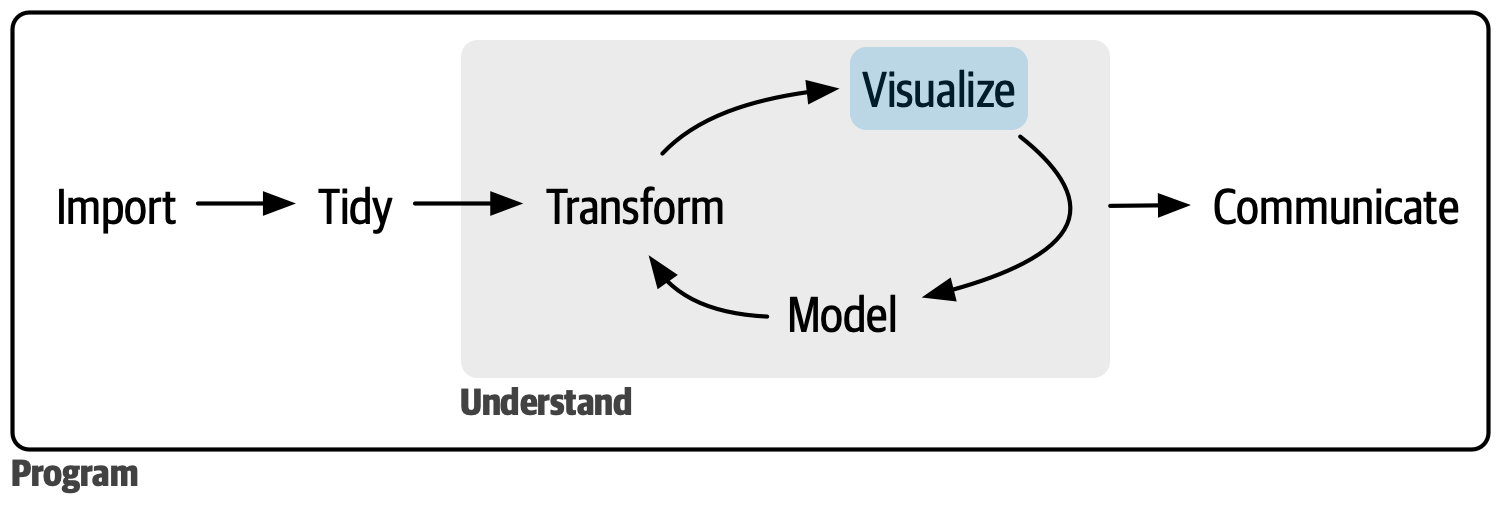
阅读本书的第一部分后,您了解了(至少表面上)进行数据科学的最重要的工具。 现在是时候开始深入研究细节了。 在本书的这一部分中,您将进一步深入了解数据可视化。
每一章都会讨论创建数据可视化的一到几个方面。
在 Chapter 10 中,您将了解图形的分层语法。
在 ?sec-exploratory-data-analysis 中,您将把可视化与好奇心和怀疑精神结合起来,提出并回答有关数据的有趣问题。
最后,在 ?sec-communication 中,您将学习如何获取探索性图形,提升它们,并将它们转化为说明性图形,这些图形可以帮助分析新手尽可能快速、轻松地了解正在发生的事情。
这三章让您开始进入可视化世界,但还有很多东西需要学习。 了解更多信息的绝对最佳地点是 ggplot2 book:ggplot2: Elegant graphics for data analysis。 它更深入地介绍了基本理论,并提供了更多关于如何组合各个部分来解决实际问题的示例。 另一个很棒的资源是 ggplot2 扩展库 https://exts.ggplot2.tidyverse.org/gallery/。 该站点列出了许多使用新的几何和比例扩展 ggplot2 的软件包。 如果您尝试用 ggplot2 做一些看似困难的事情,那么这是一个很好的起点。