---
author: "Hu Zheng"
date: "2025-12-01"
date-format: YYYY-MM-DD
---
# FigureS3
```{r}
#| warning: false
#| message: false
library(Seurat)
library(tidyverse)
library(monocle)
library(SCopeLoomR)
library(ggrepel)
source('bin/Palettes.R')
```
```{r}
seu.harmony <- readRDS('../data/seu.harmony.rds')
seu.IT <- subset(seu.harmony, cells=colnames(seu.harmony)[which(
  seu.harmony$SubType %in% names(col_SubType)[1:8]
)])
cds <- readRDS("../data/Figure3/cds.rds")
```
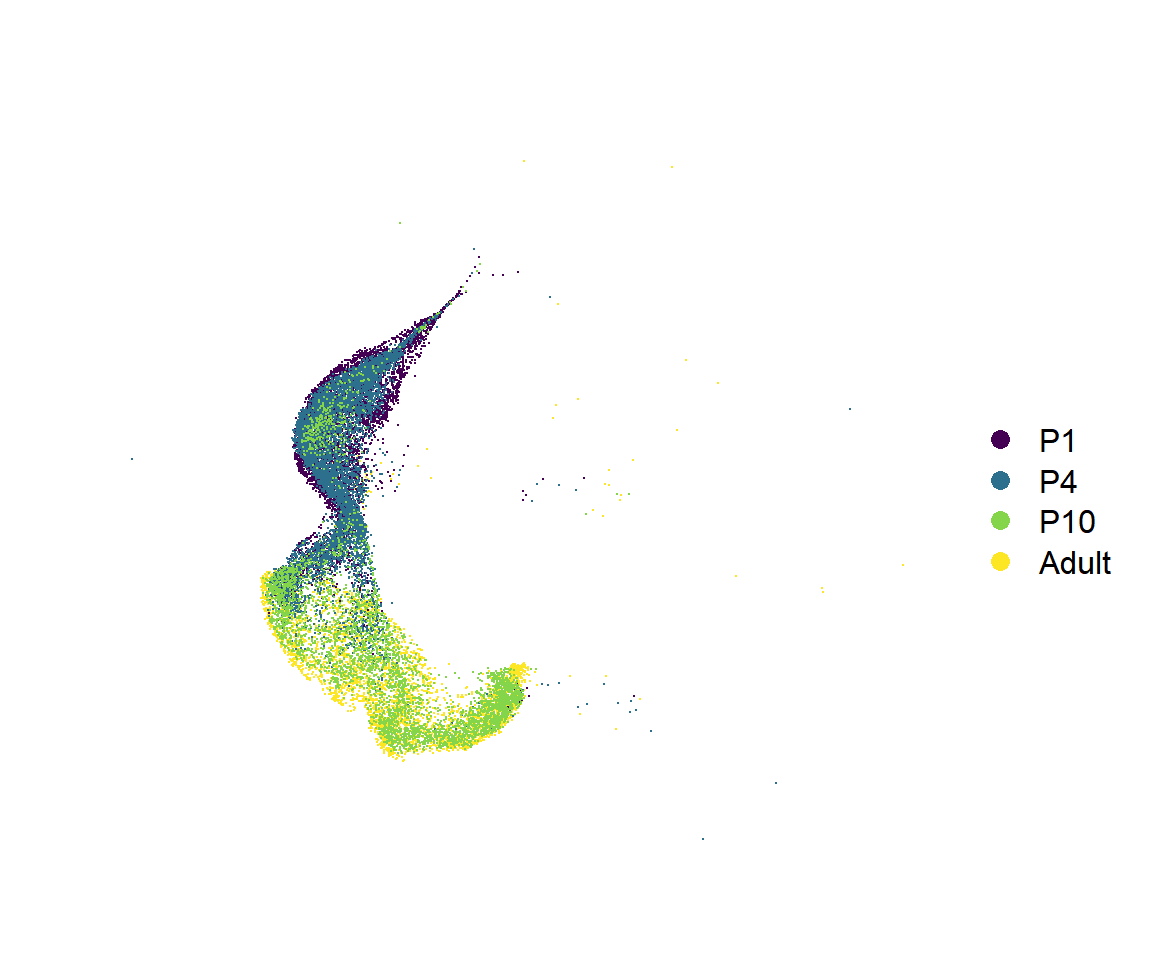
## Figure_S3A
```{r fig.width=6, fig.height=5}
seu <- seu.IT
seu$orig.ident <- factor(seu$orig.ident, levels = c("P1","P4","P10","Adult"))
Figure_S3A <-
  DimPlot(seu,
        reduction = 'umap', group.by = "orig.ident", label = F,
        cols = col_Time) +
  theme(axis.line = element_blank(), axis.ticks = element_blank(),
        axis.text = element_blank(), plot.title = element_text(size = 30)) +
  labs(x='', y='', title = "") +
  coord_fixed()
Figure_S3A
```
```{r}
#| eval: false
ggsave("../../Figure/FigureS3/Figure_S3A.pdf", plot = Figure_S3A,
       height = 5, width = 6, units = "in")
```
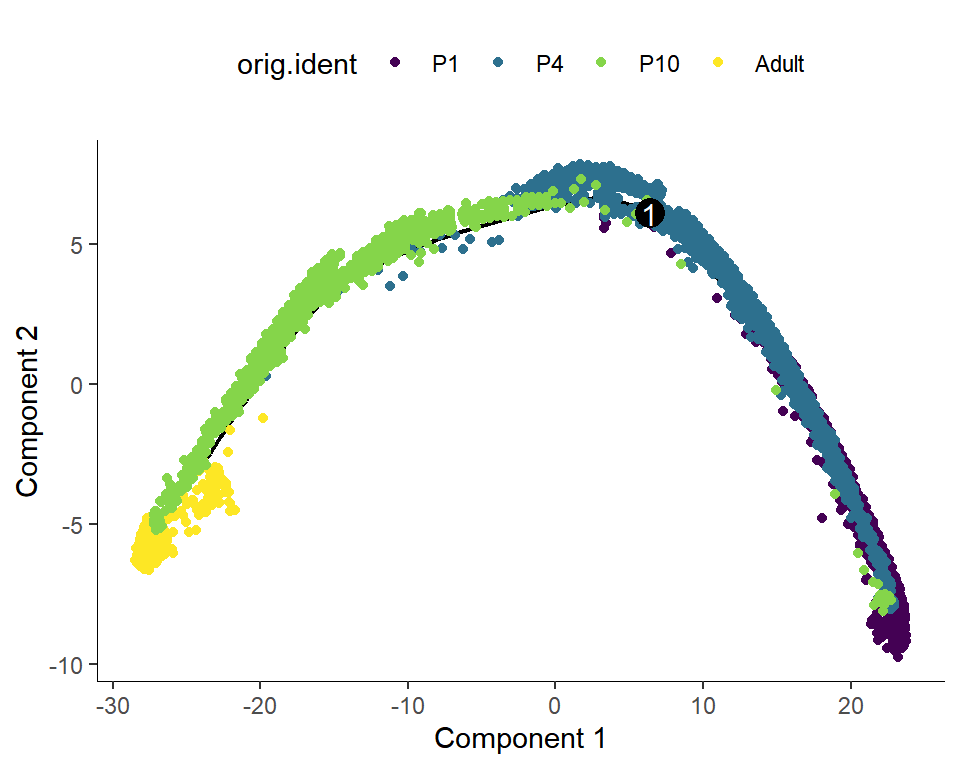
## Figure_S3B
```{r fig.width=5, fig.height=4}
#| warning: false
#| message: false
Figure_S3B <-
  plot_cell_trajectory(cds, color_by = "Pseudotime") +
  scale_color_gradientn(colours = sciRcolor::pal_scircolor(96))
Figure_S3B
```
```{r}
#| eval: false
ggsave("../../Figure/FigureS3/Figure_S3B.pdf", plot = Figure_S3B,
       height = 4, width = 5, units = "in")
```
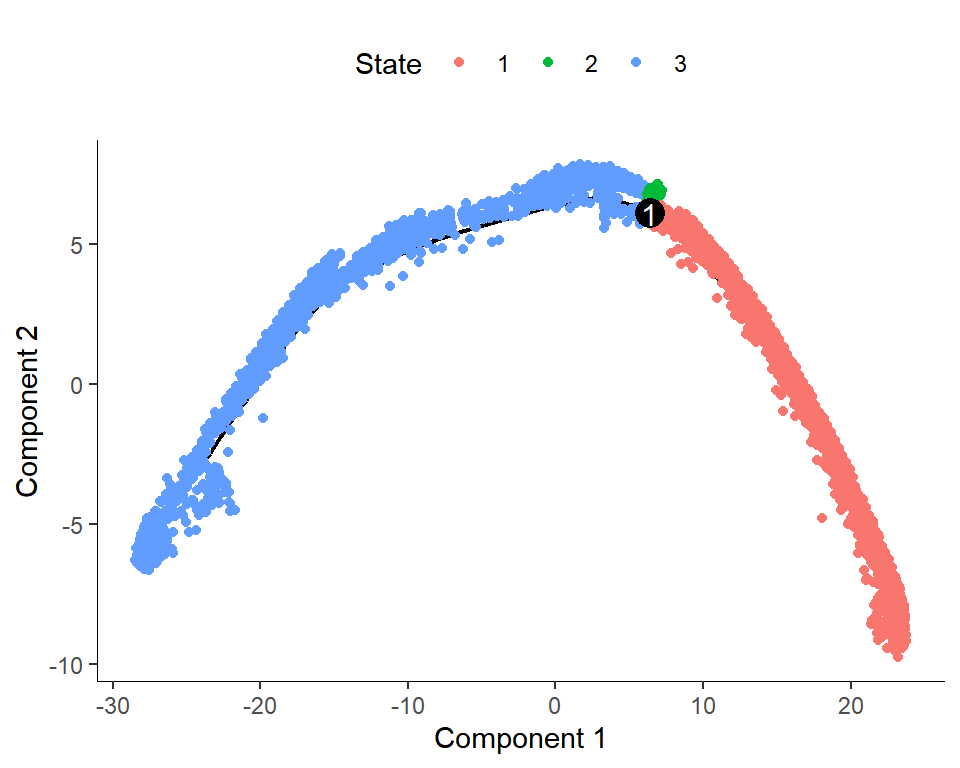
## Figure_S3C
```{r fig.width=5, fig.height=4}
#| warning: false
cds$orig.ident <- factor(cds$orig.ident, levels = c("P1","P4","P10","Adult"))
Figure_S3C <-
  plot_cell_trajectory(cds, color_by = "State")
Figure_S3C
```
```{r}
#| eval: false
ggsave("../../Figure/FigureS3/Figure_S3C.pdf", plot = Figure_S3C,
       height = 4, width = 5, units = "in")
```
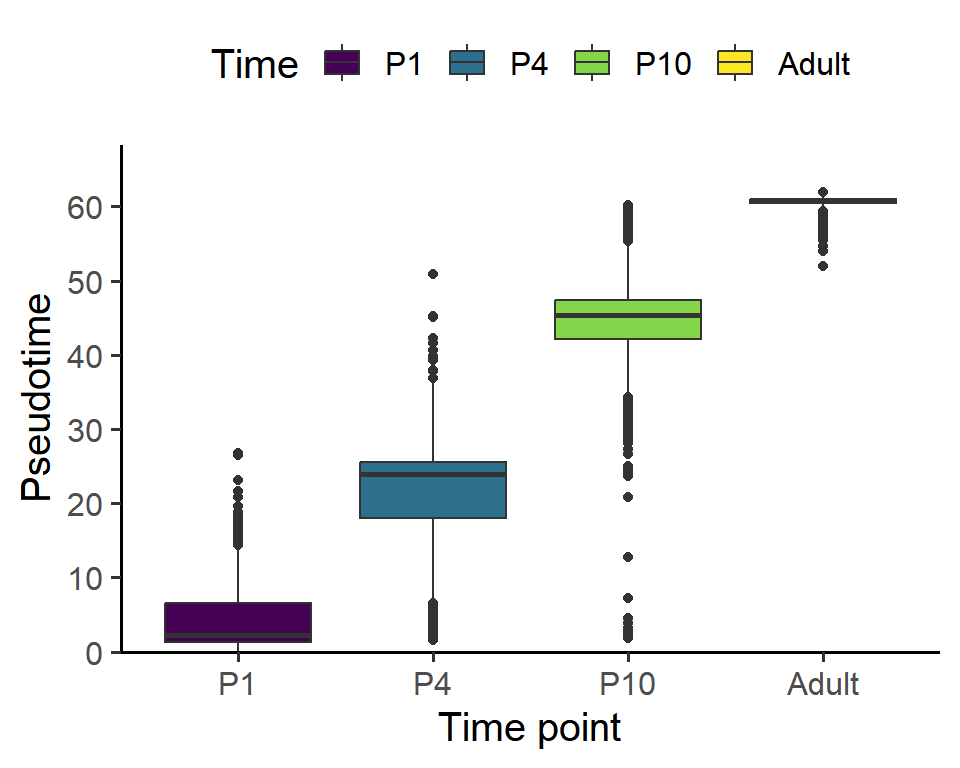
## Figure_S3D
```{r fig.width=5, fig.height=4}
#| warning: false
data <- data.frame(
  Pseudotime = cds$Pseudotime,
  Time = as.character(cds$orig.ident)
)

data$Time <- factor(data$Time, levels = c("P1","P4","P10","Adult"))
Figure_S3D <-
  ggplot(data, aes(x=Time, y=Pseudotime, fill=Time)) +
  geom_boxplot() +
  labs(x="Time point", y="Pseudotime") +
  scale_y_continuous(breaks=seq(0,65,10), limits = c(0,65),
                     expand = expansion(mult = c(0, 0.05))) +
  theme_classic(base_size = 15) +
  theme(legend.position = "top") +
  scale_fill_manual(values = col_Time)
Figure_S3D
```
```{r}
#| eval: false
ggsave("../../Figure/FigureS3/Figure_S3D.pdf", plot = Figure_S3D,
       height = 4, width = 5, units = "in")
```
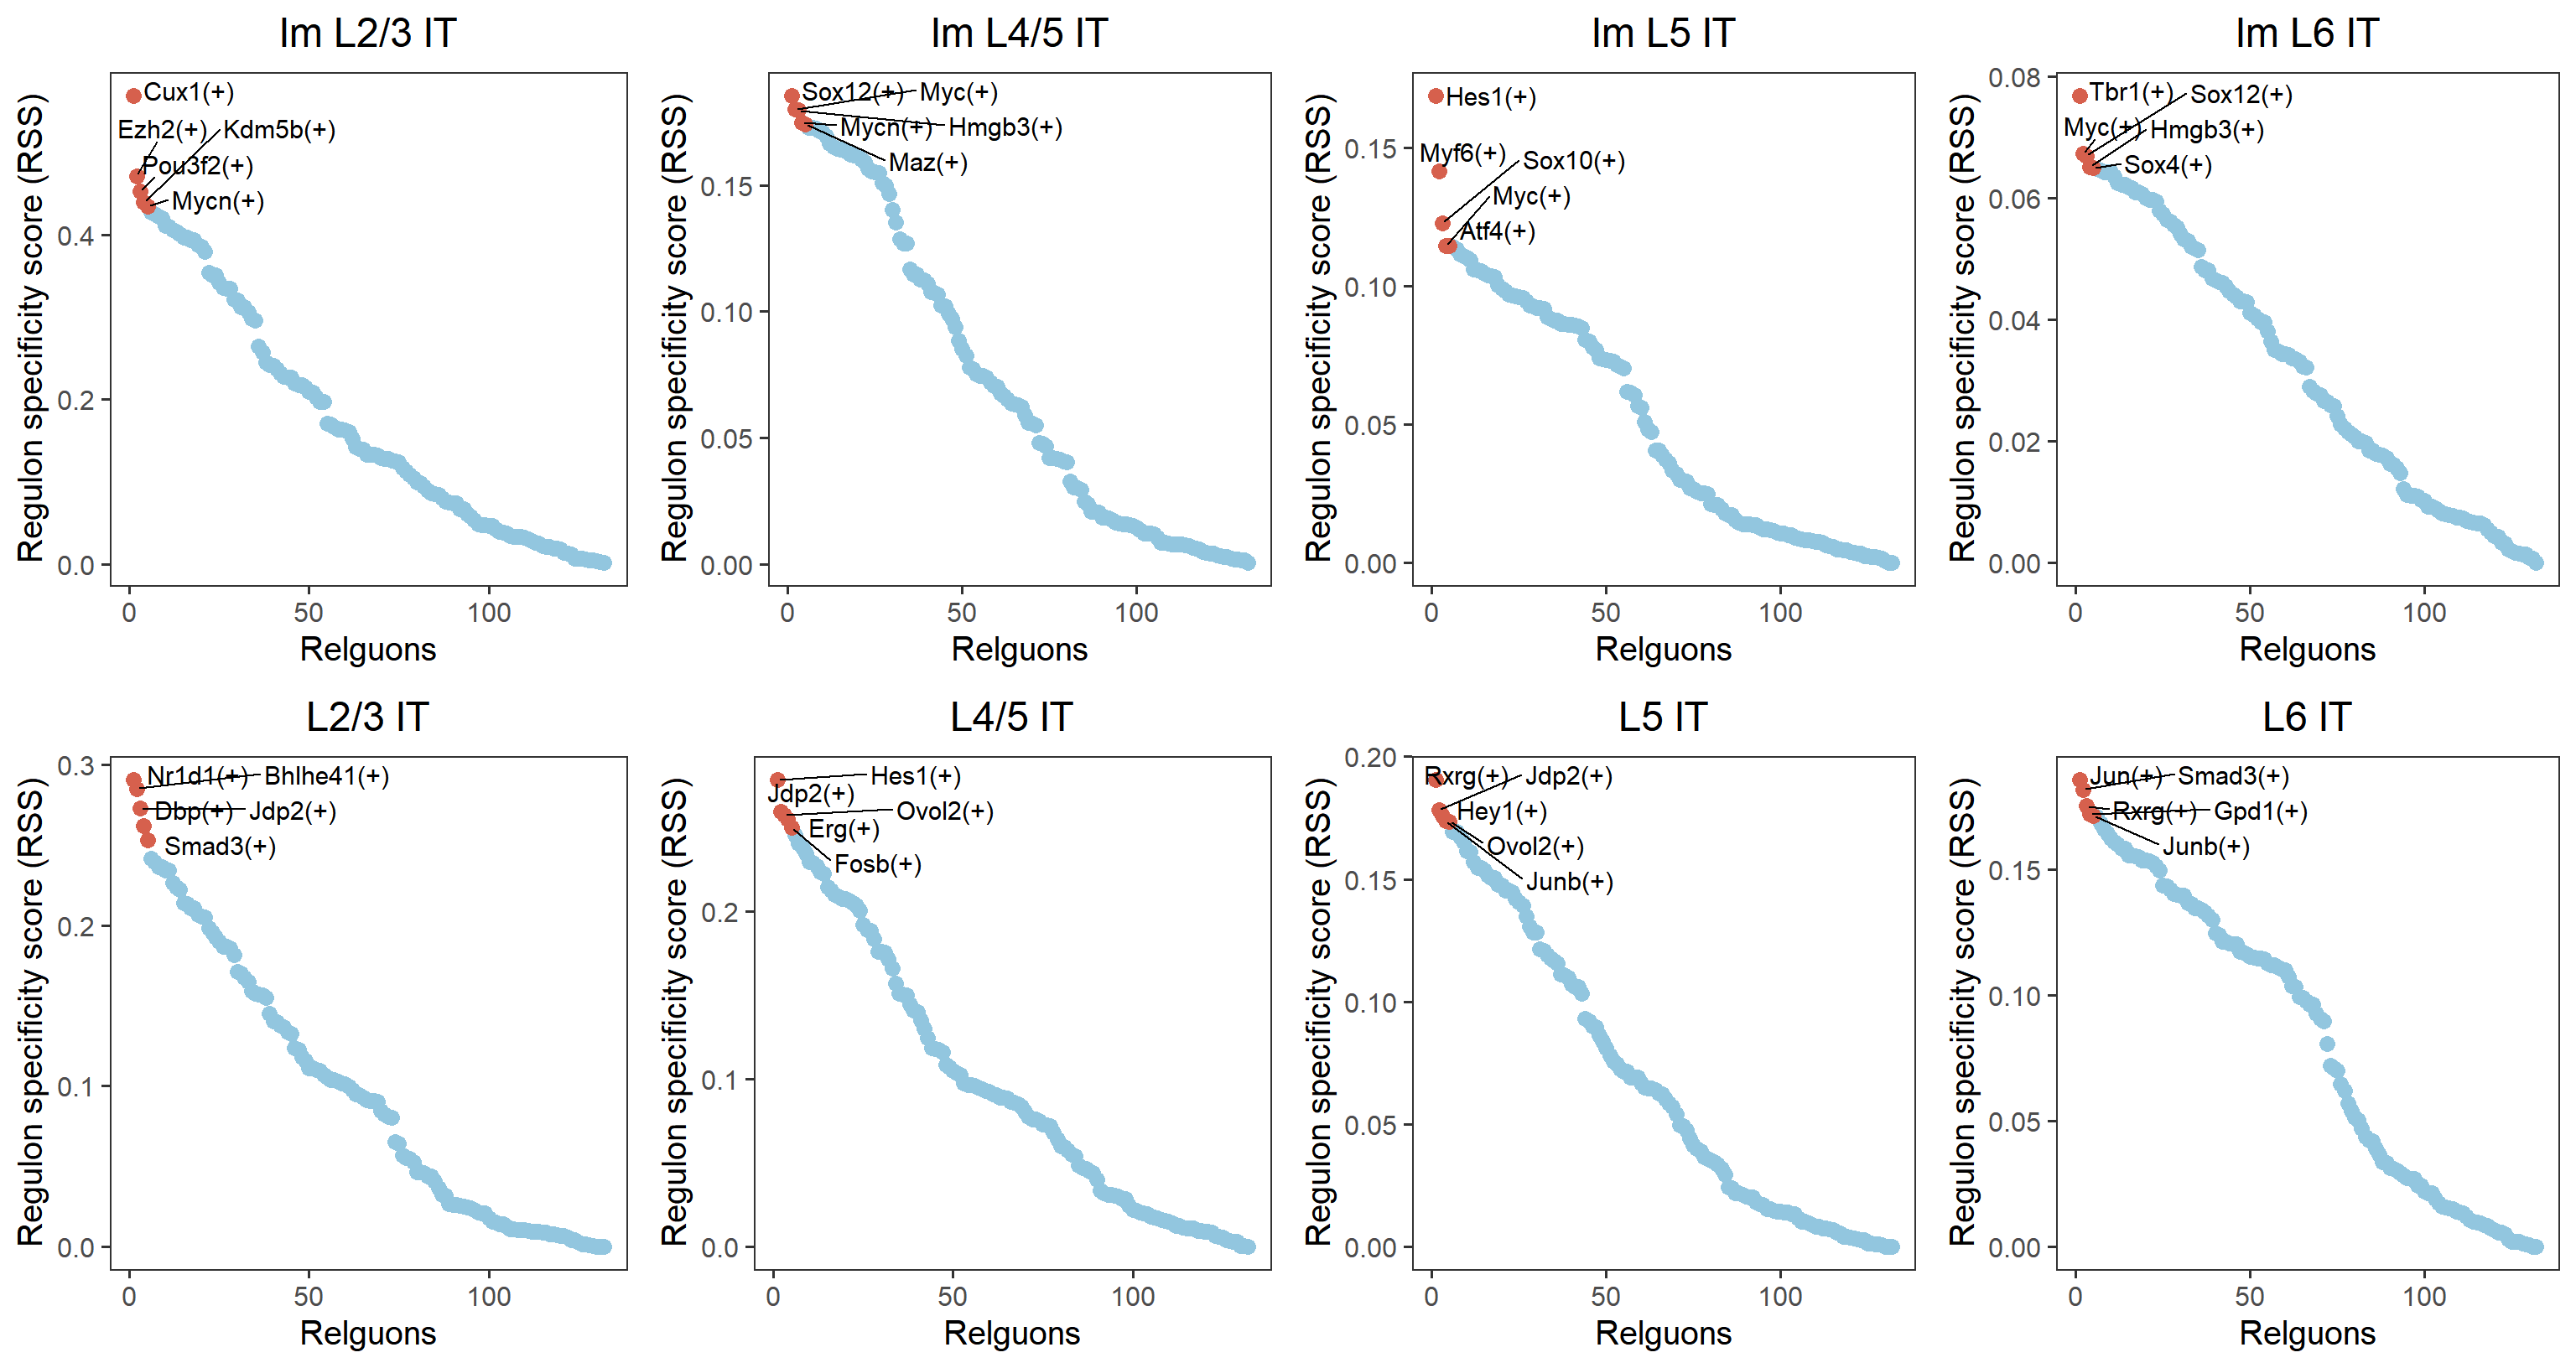
## Figure_S3E
```{r}
#| message: false
#| warning: false
loom <- open_loom('../data/Figure3/SCENIC/aucell.loom')
regulons_incidMat <- SCopeLoomR::get_regulons(loom, column.attr.name="Regulons")
regulonAUC <- SCopeLoomR::get_regulons_AUC(loom,column.attr.name='RegulonsAUC')
```
```{r fig.width=16, fig.height=8.5}
seu <- seu.IT
seu$Time_subtype <- seu$SubType
Time_subtype <- names(col_SubType)[1:8]
#rss <- calcRSS(AUC = getAUC(regulonAUC)[,seu$Time_subtype %in% Time_subtype],
#               cellAnnotation = as.character(seu$Time_subtype[seu$Time_subtype %in% Time_subtype]))
#rss <- as.data.frame(rss)
#saveRDS(rss, "../../data/rds/Figure3/rss.rds")
rss <- readRDS("../data/Figure3/SCENIC/rss.rds")

Time_all <- Time_subtype
plist <- list()
for (i in 1:length(Time_subtype)){
  Time <- Time_all[i]
  data <- rss
  data$label <- rownames(data)
  data$label[!rownames(data) %in% rownames(data[order(data[,Time],
                                                      decreasing = T),])[1:5]] <- ""
  data <- data[order(data[,Time], decreasing = T),c(Time, "label")]
  colnames(data) <- c("Rss", "label")
  data$Type <- "highlight"
  data$Type[data$label==""] <- "other"

  plist[[i]] <-
    ggplot() +
    geom_point(data[data$Type=="other",], mapping=aes(x=6:nrow(data), y=Rss), size=3, color="#92c6df") +
    geom_point(data[data$Type=="highlight",], mapping=aes(x=1:5, y=Rss), size=3, color="#d6604d") +
    geom_text_repel(data, mapping=aes(x=1:nrow(data), y=Rss, label = label),
                  max.overlaps = getOption("ggrepel.max.overlaps", default = 20),
                  size = 4,
                  color = 'black') +
    theme_bw(base_size = 15) +
    theme(panel.grid = element_blank(), legend.position = "none",
          plot.title = element_text(hjust = 0.5)) +
    labs(x="Relguons", y="Regulon specificity score (RSS)", title=Time)
}

Figure_S3E <- cowplot::plot_grid(plotlist = plist, ncol = 4)
Figure_S3E
```
```{r}
#| eval: false
ggsave("../../Figure/FigureS3/Figure_S3E.pdf", plot = Figure_S3E,
       height = 8.5, width = 16, units = "in")
```