---
author: "Hu Zheng"
date: "2025-12-01"
date-format: YYYY-MM-DD
---
# Figure1
```{r}
#| warning: false
#| message: false
library(Seurat)
library(tidyverse)
source('bin/Palettes.R')
```
```{r}
#| warning: false
#| message: false
seu.harmony <- readRDS('../data/seu.harmony.rds')
```
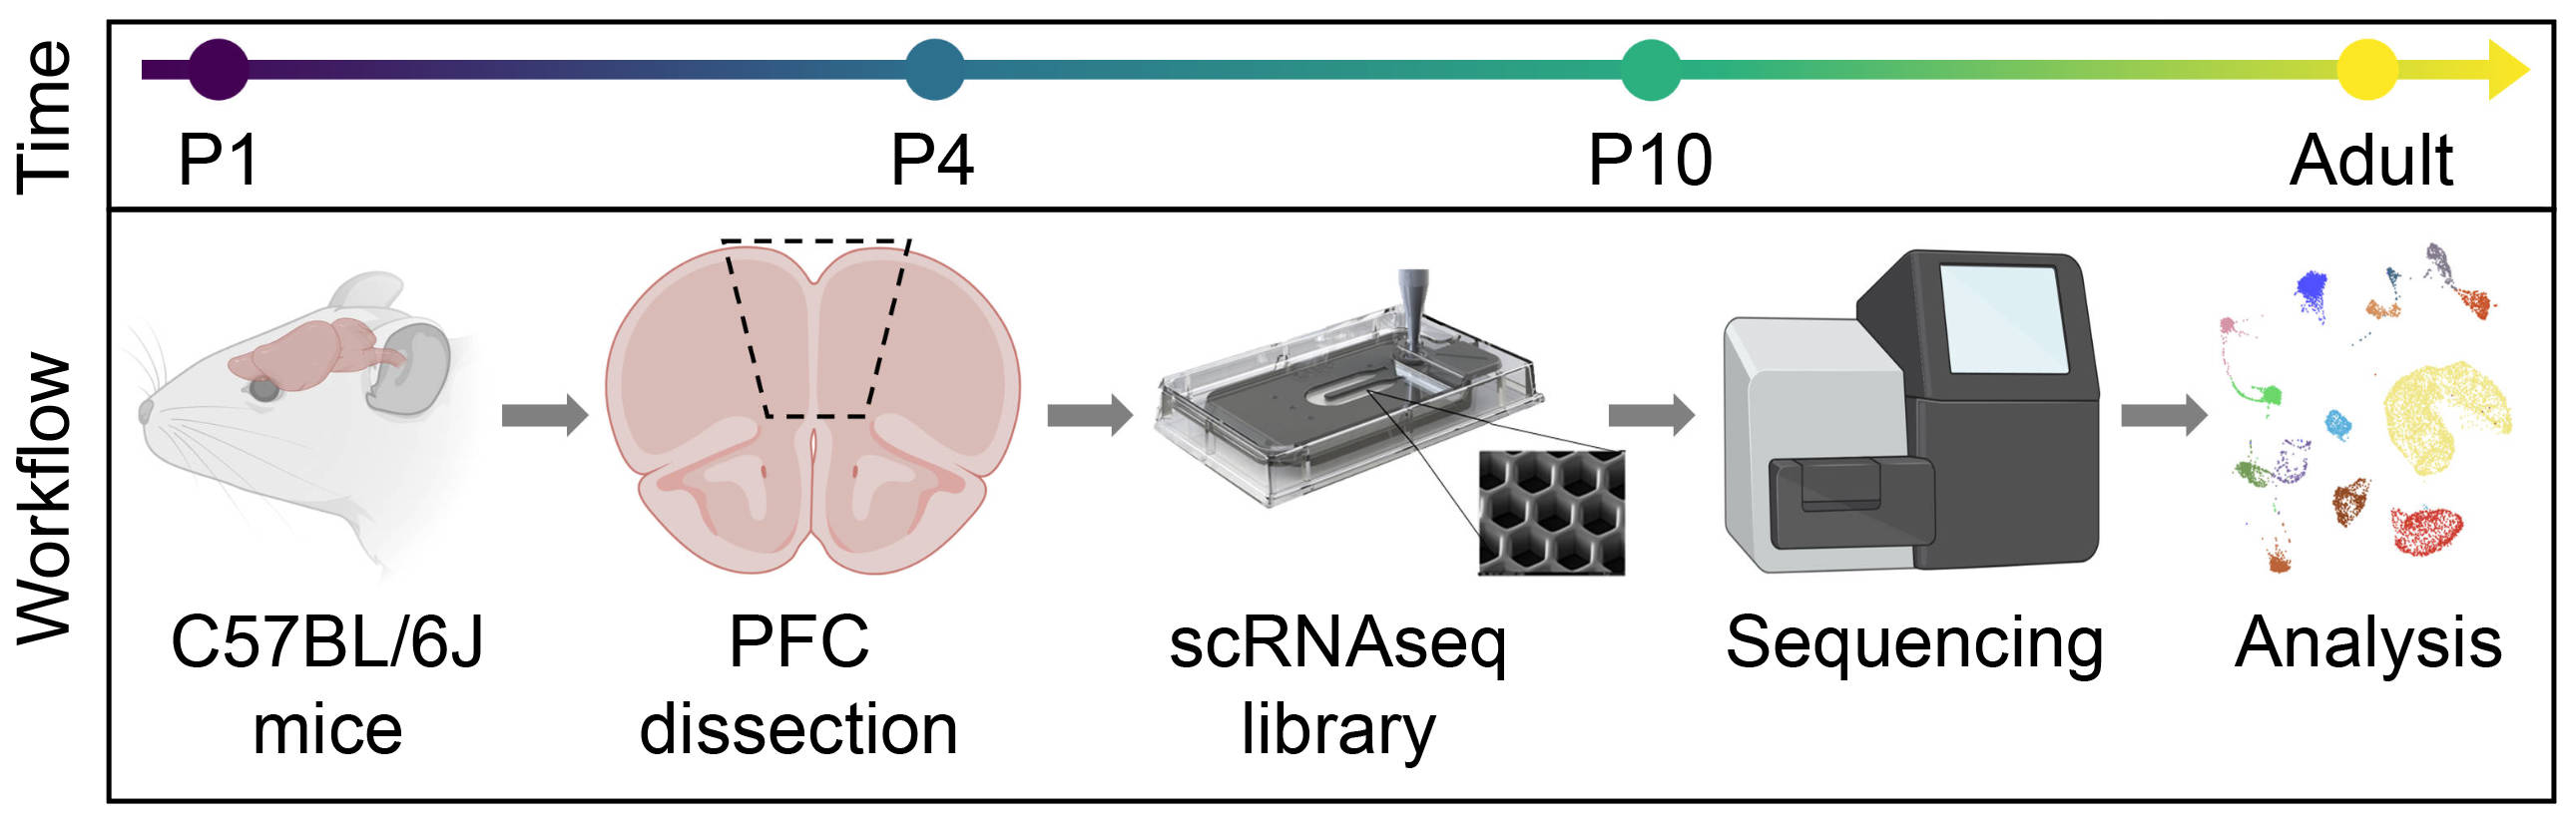
## Figure_1A
```{r}
knitr::include_graphics("./images/Figure_1A.jpg", dpi = 300)
```
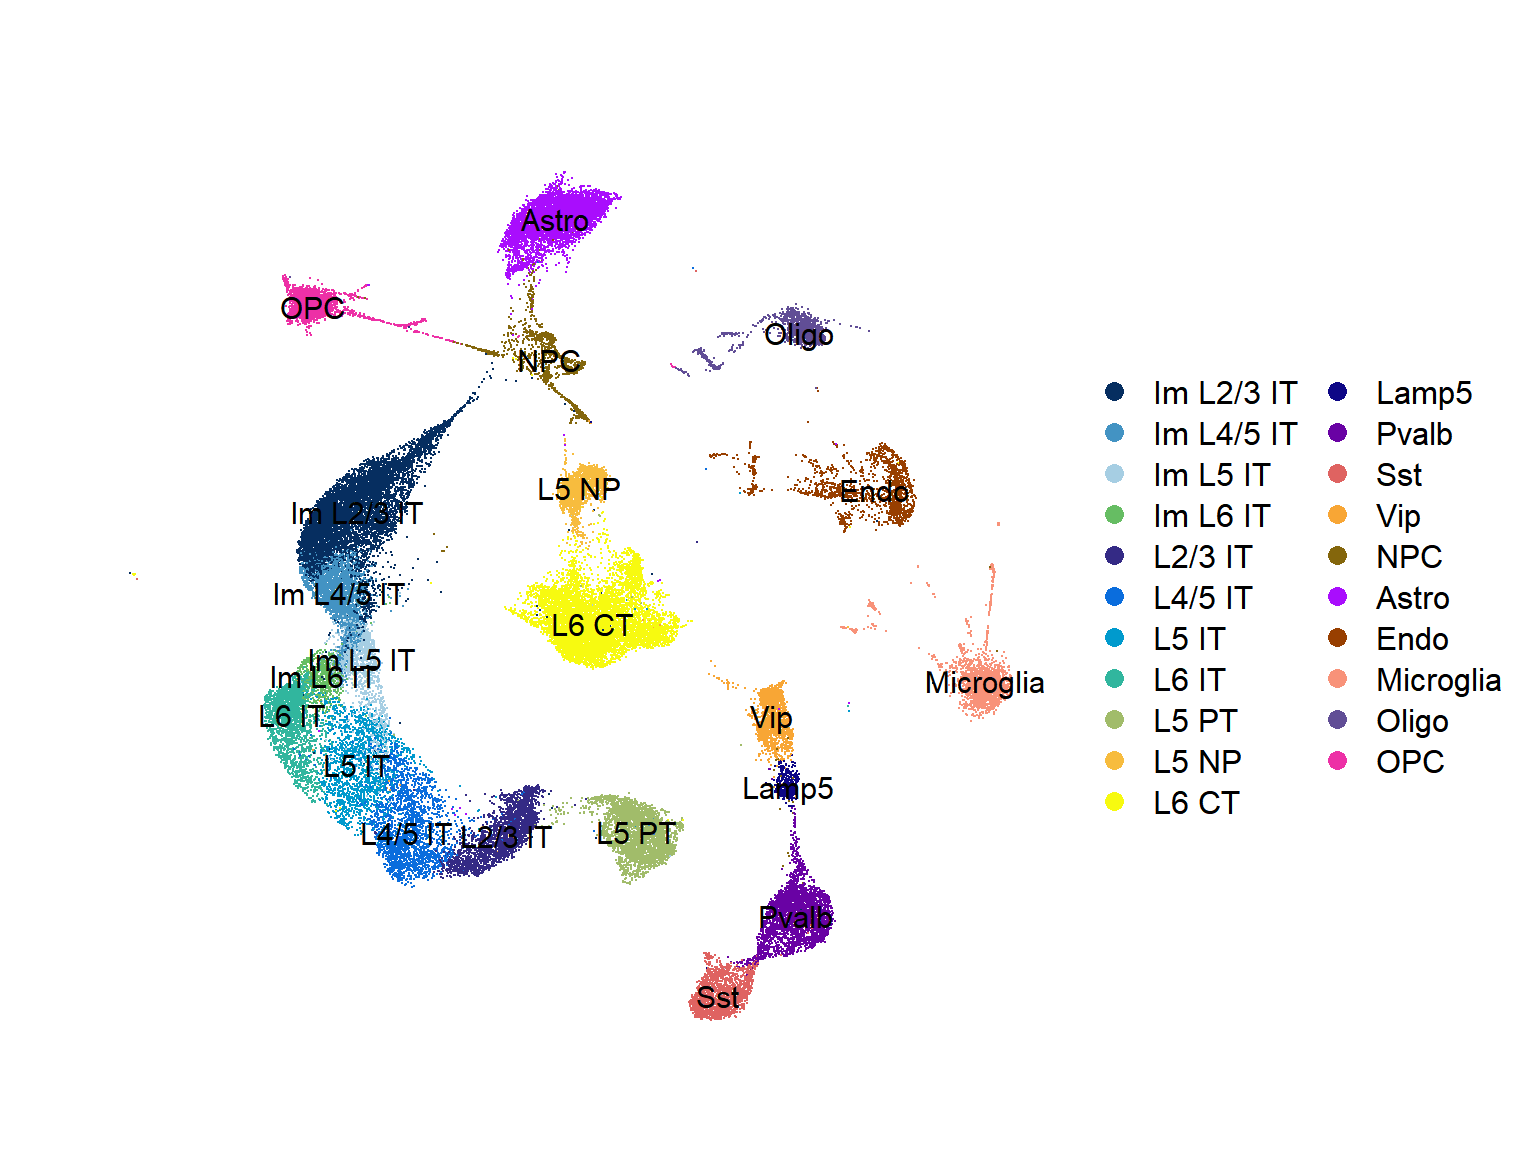
## Figure_1B
```{r fig.width=8, fig.height=6}
seu <- seu.harmony
seu$SubType <- factor(seu$SubType, levels = names(col_SubType))
Figure_1B <-
  DimPlot(seu,
        reduction = 'umap', group.by = "SubType", label = T,
        cols = col_SubType) +
  theme(axis.line = element_blank(), axis.ticks = element_blank(),
        axis.text = element_blank(), plot.title = element_text(size = 30)) +
  labs(x='', y='', title = "") +
  coord_fixed()
Figure_1B
```
```{r}
#| eval: false
ggsave("../../Figure/Figure1/Figure_1B.pdf", plot = Figure_1B,
       height = 6, width = 8, units = "in")
```
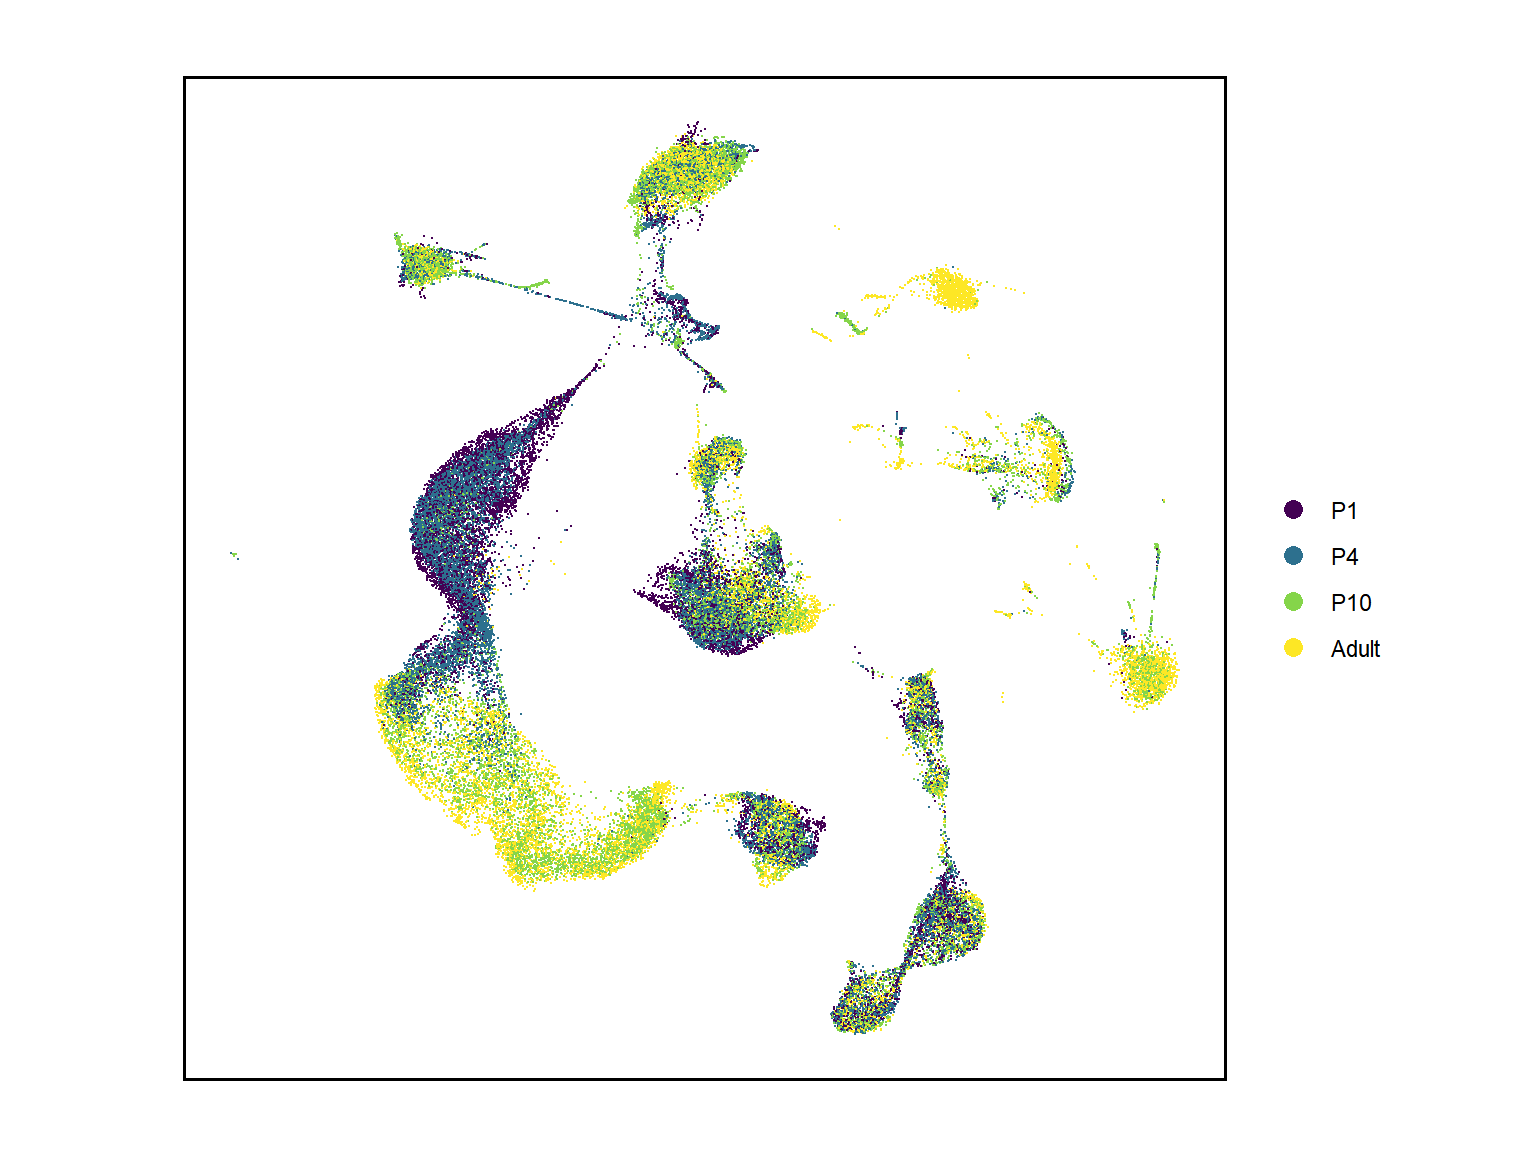
## Figure_1C
```{r fig.width=8, fig.height=6}
seu <- seu.harmony
seu$orig.ident <- factor(seu$orig.ident, levels = c("P1","P4","P10","Adult"))

Figure_1C <-
  DimPlot(seu,
          reduction = 'umap', group.by = "orig.ident", label = F, shuffle=T,
          seed=123, cols = col_Time) +
  theme(panel.grid = element_blank(),
        axis.text = element_blank(), axis.ticks = element_blank(),
        panel.border = element_rect(color = "black", linewidth = 1)) +
  labs(x='', y='', title = "") +
  coord_fixed()
Figure_1C
```
```{r}
#| eval: false
ggsave("../../Figure/Figure1/Figure_1C.pdf", plot = Figure_1C,
       height = 6, width = 8, units = "in")
```
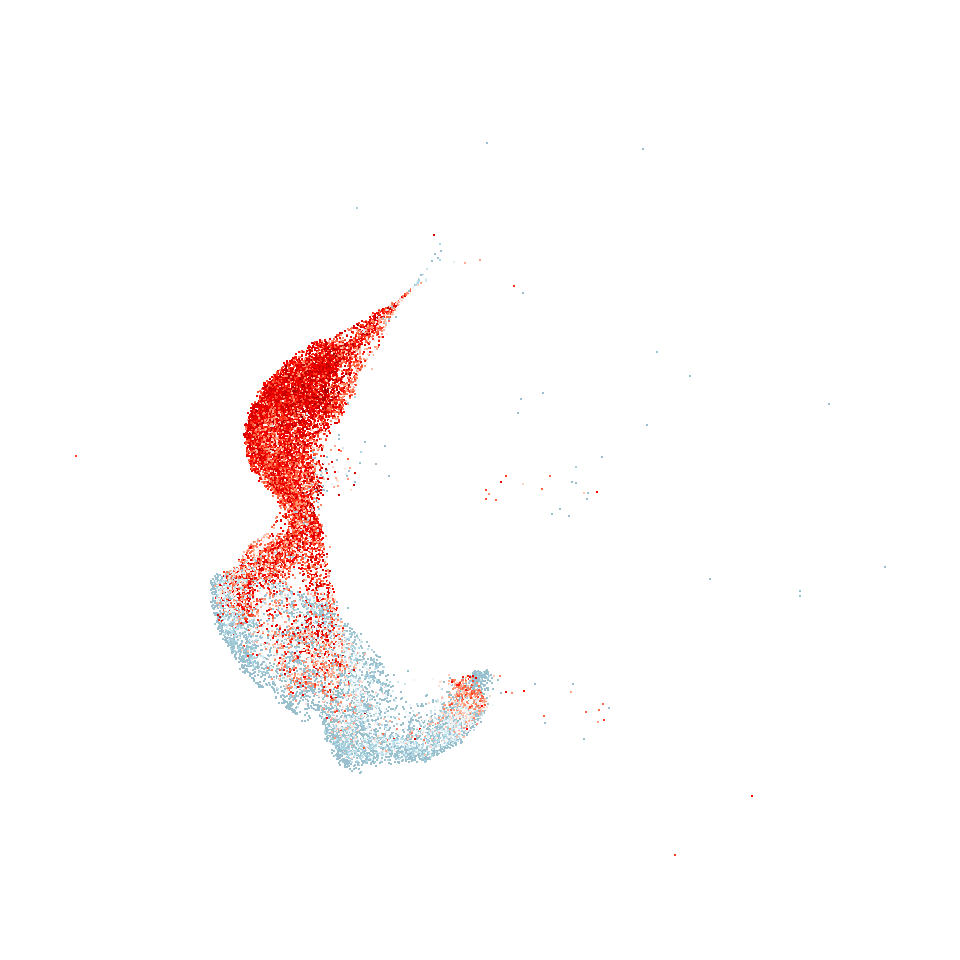
## Figure_1D
```{r fig.width=5, fig.height=5}
#| message: false
Figure_1D <-
  FeaturePlot(subset(
    seu.harmony,
    cells = colnames(seu.harmony)[which(seu.harmony$SubType %in% names(col_SubType)[1:8])]),
    features = "Cd24a", order = F) +
  scale_color_gradientn(colours = c("lightblue3", "lightblue", "white", "red", "red4"), limits=c(0,4), na.value = "red4") +
  coord_fixed() +
  theme_void() +
  theme(legend.position = "none") +
  labs(title = "")
Figure_1D
```
```{r}
#| eval: false
ggsave("../../Figure/Figure1/Figure_1D/Cd24a.png", plot = Figure_1D,
       height = 5, width = 5, units = "in")
```
## Figure_1E
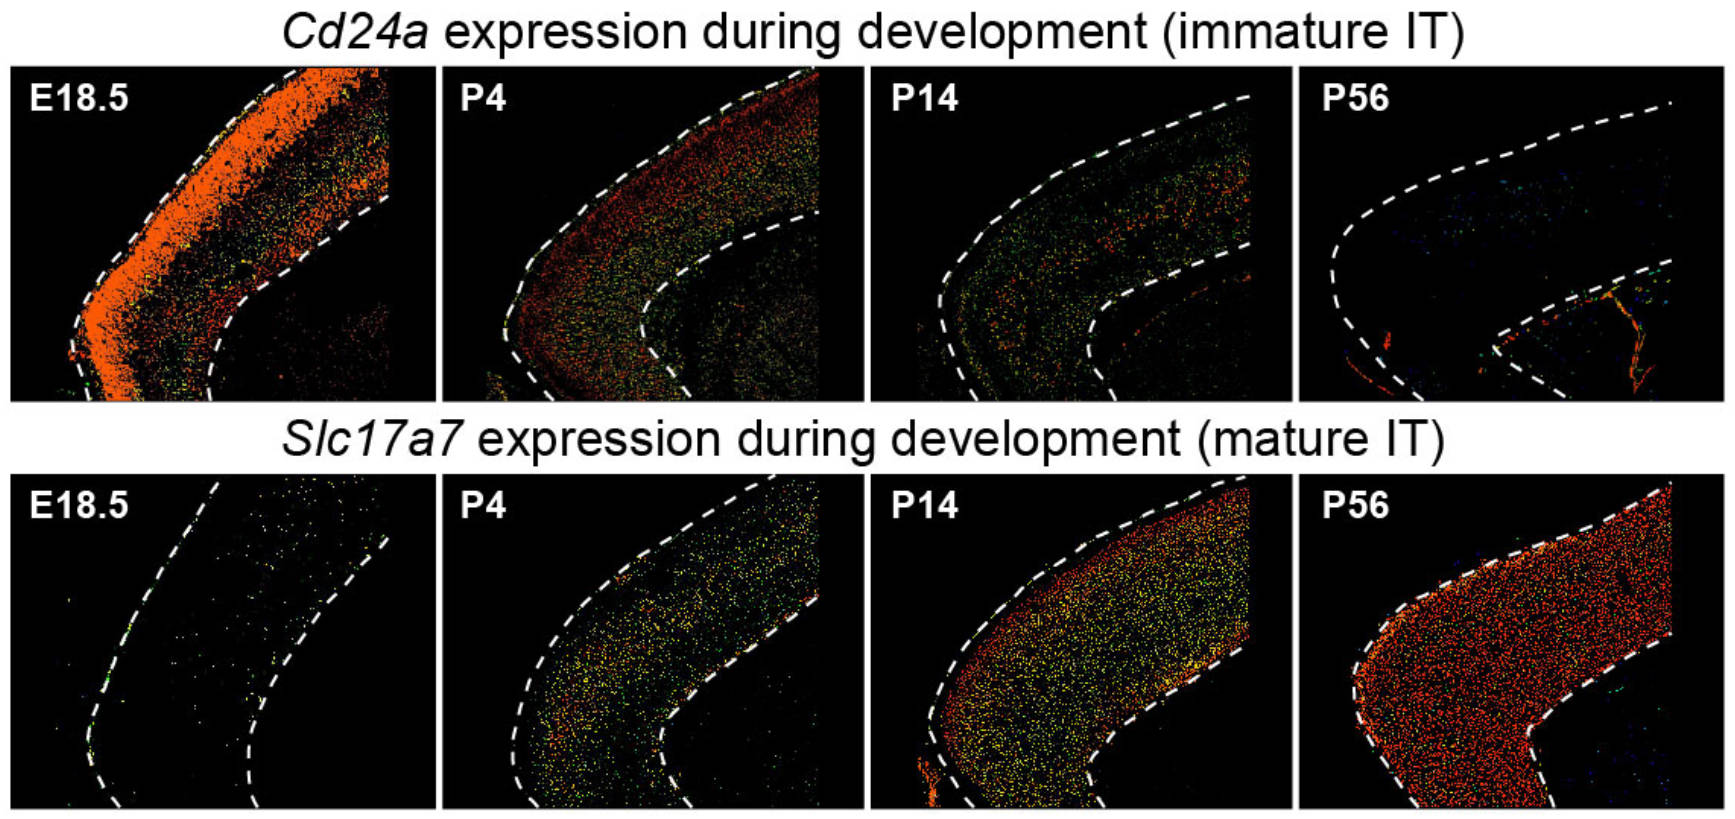
```{r}
knitr::include_graphics("./images/Figure_1E.jpg", dpi = 300)
```
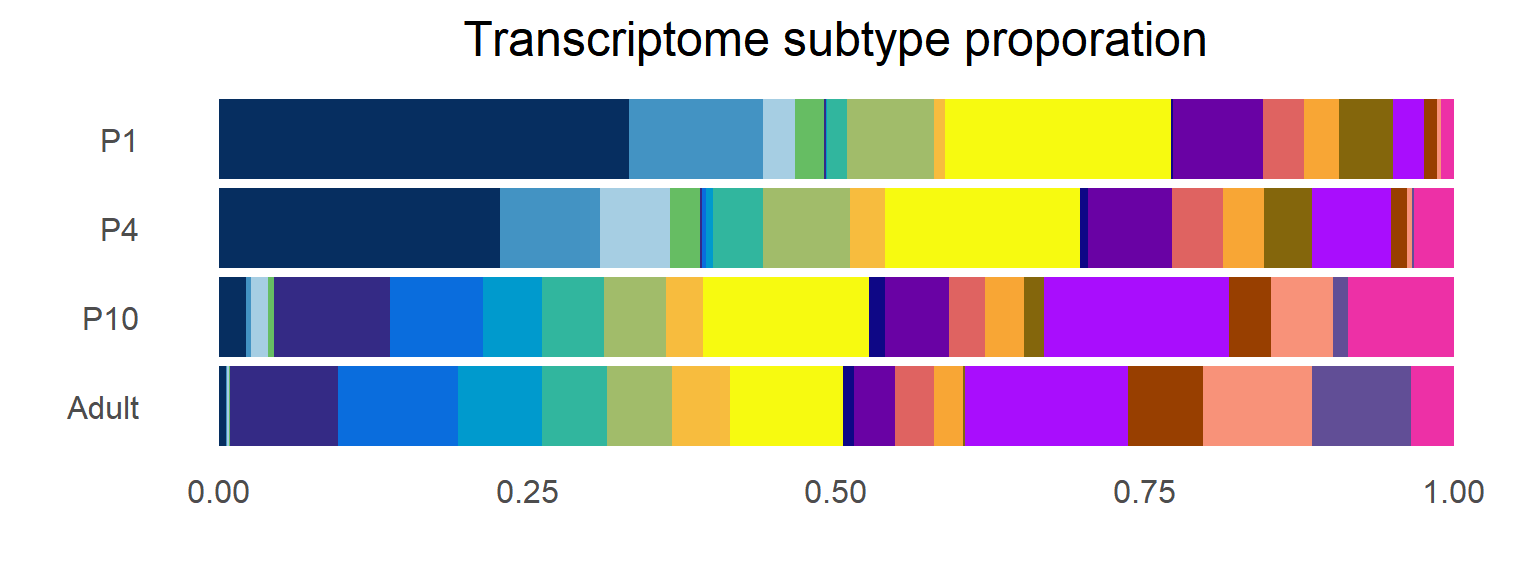
## Figure_1F
```{r fig.width=8, fig.height=6}
df <- seu.harmony@meta.data[,c("orig.ident","SubType")]
df <- table(df$orig.ident, df$SubType)
df <- as.data.frame(df/rowSums(df))
colnames(df) <- c("Time", "Subtype", "Prob")
df$Time <- factor(df$Time, levels = rev(c("P1","P4","P10","Adult")))
df$Subtype <- factor(df$Subtype, levels = rev(names(col_SubType)))

Figure_1F <-
  ggplot(df, aes(x = Time, y = Prob, fill = Subtype)) +
  geom_bar(stat = "identity", width = 0.9) +
  scale_fill_manual(values = col_SubType) +
  labs(x='', y='', title='') +
  theme_minimal(base_size = 15) +
  theme(panel.grid = element_blank(), plot.title = element_text(hjust = 0.5),
        legend.position = "bottom",
        legend.title = element_blank()) +
  labs(title = "Transcriptome subtype proporation") +
  coord_flip()
Figure_1F
```
```{r}
#| eval: false
ggsave("../../Figure/Figure1/Figure_1F.pdf", plot = Figure_1F,
       height = 3, width = 8, units = "in")
```
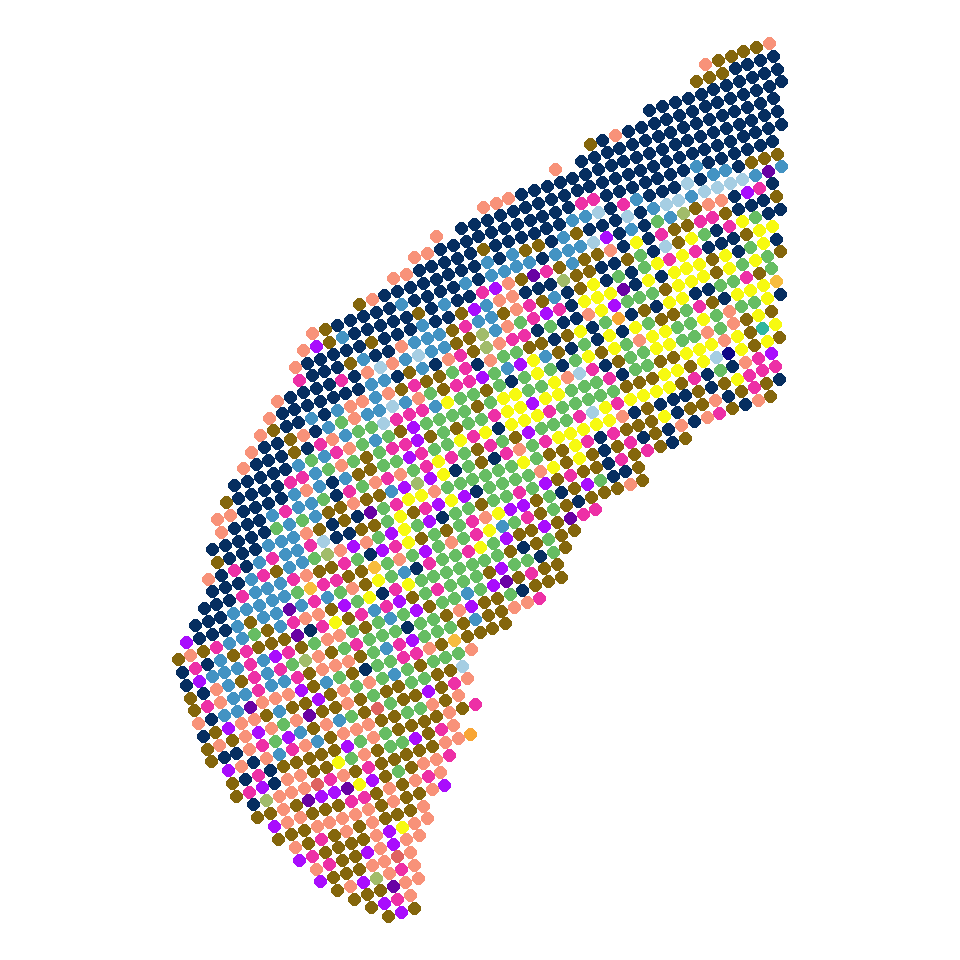
## Figure_1G
```{r fig.width=5, fig.height=5}
column <- c("x_rotated","y_rotated","Im.L2.3.IT","Im.L4.5.IT","Im.L5.IT","Im.L6.IT","L2.3.IT","L4.5.IT","L5.IT","L6.IT","L5.PT","L5.NP","L6.CT","Lamp5","Pvalb","Sst","Vip","NPC","Astro","Endo","Microglia","Oligo","OPC")
P1_cell2loc <- read.csv("../data/Figure1/P1_cell2location.csv", row.names = 1)
P1_cell2loc <- P1_cell2loc[,column]
colnames(P1_cell2loc) <- c("x_rotated","y_rotated",names(col_SubType))
P1_cell2loc$SubType <- as.character(apply(P1_cell2loc[,names(col_SubType)], 1, function(x){
names(which.max(x))
}))
data <- P1_cell2loc
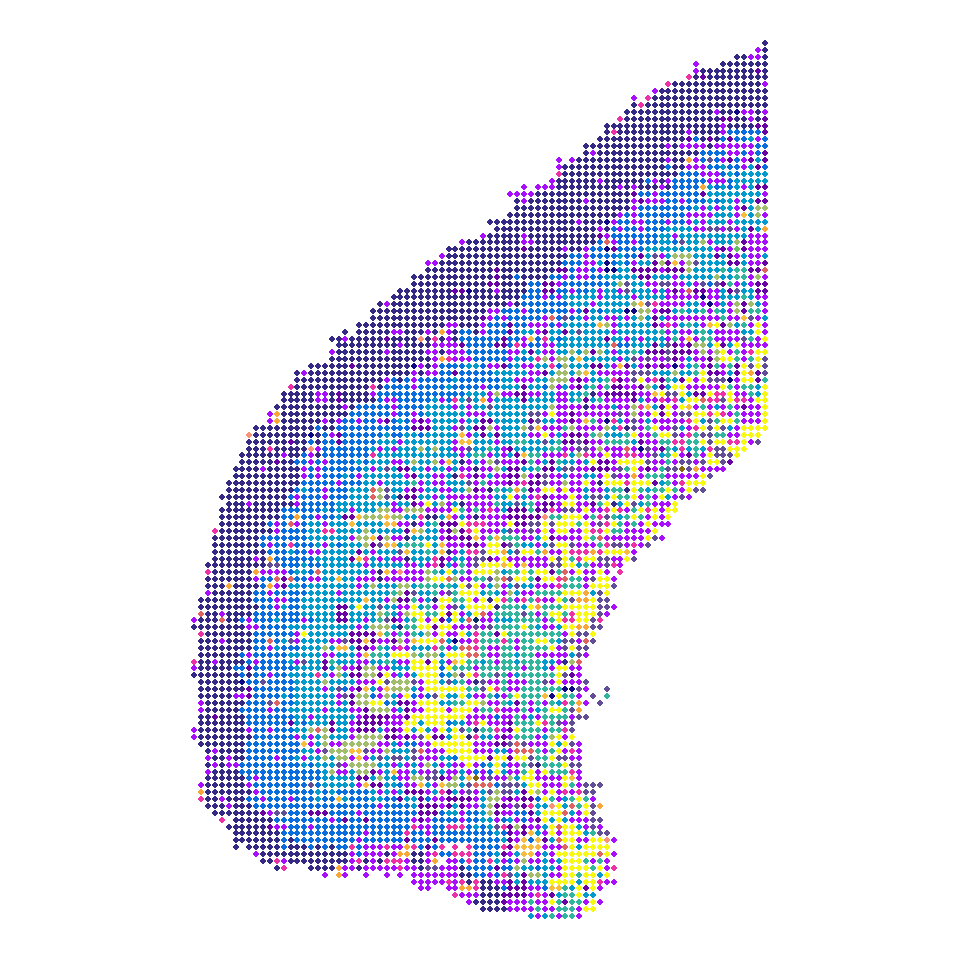
Figure_1G <-
ggplot(data, mapping = aes(x_rotated, y_rotated, color=SubType)) +
geom_point(size = 2) +
scale_color_manual(values = col_SubType) +
coord_fixed() +
theme_void() +
theme(legend.position = "none")
Figure_1G
```
```{r}
#| eval: false
ggsave("../../Figure/Figure1/Figure_1G.png", plot = Figure_1G,
       height = 5, width = 5, units = "in")
```
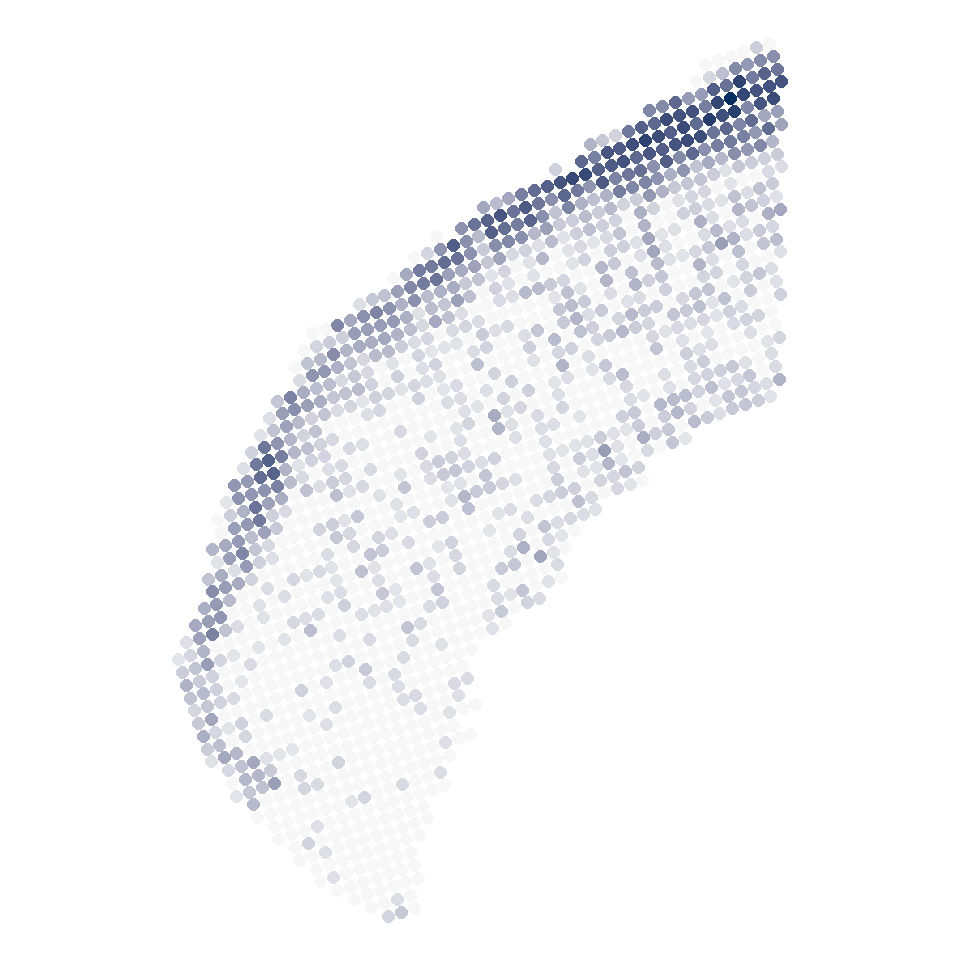
## Figure_1H
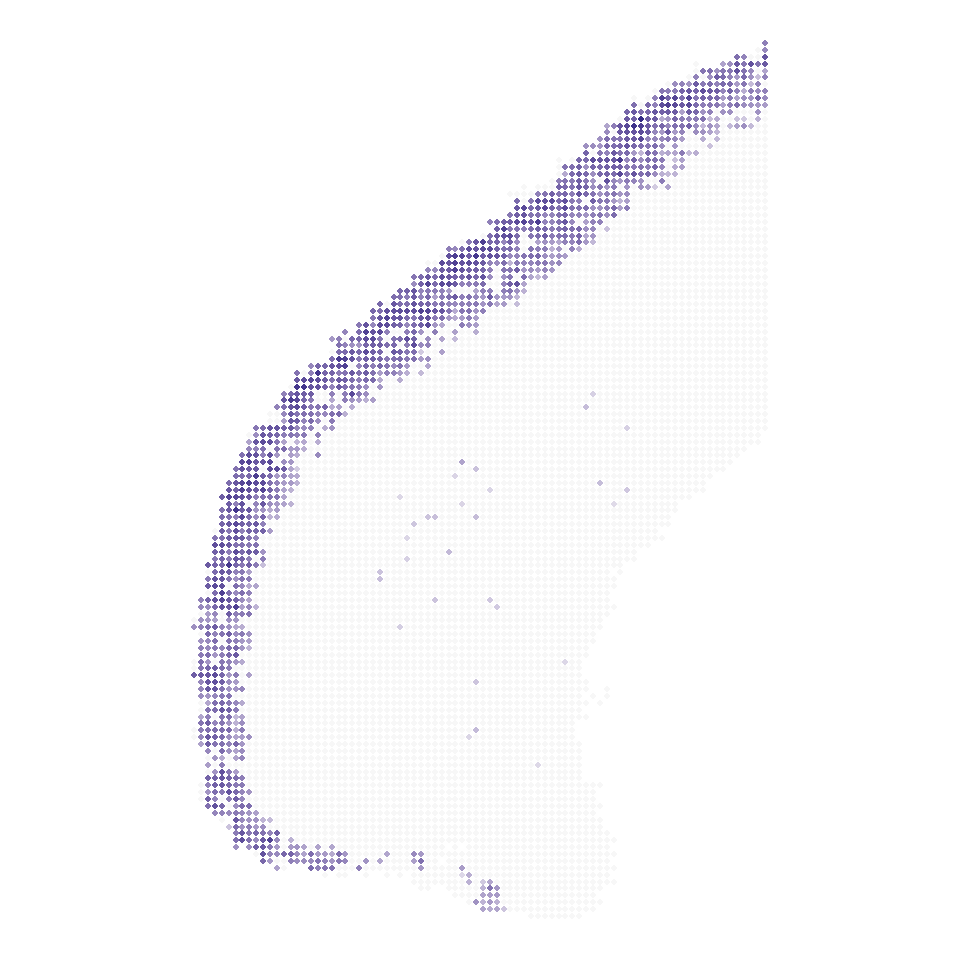
```{r fig.width=5, fig.height=5}
data <- P1_cell2loc
plist <- list()
for (i in 1:length(col_SubType)){
  subtype_i <- names(col_SubType)[i]
  df_i <- data.frame(
    x = data$x_rotated,
    y = data$y_rotated,
    col = data[,subtype_i]
  )
  df_i$col[df_i$col>1] <- 1
  df_i$col[df_i$col<0.05] <- 0

  plist[[i]] <-
    ggplot(df_i, aes(x=x, y=y, color=col)) +
    geom_point(size=2) +
    scale_color_gradient(low = "#f7f7f7", high=col_SubType[i],
                          na.value = "#f7f7f7",
                          limits = c(0,max(df_i$col)),
                          breaks = c(0,max(df_i$col))) +
    coord_fixed() +
    theme_void() +
    theme(legend.position = "none")
  subtype_i <- gsub("/","",subtype_i)
  #ggsave(paste("../../Figure/Figure1/Figure_1H/",i,".P1_",subtype_i,".png",sep=""), plot = plist[[i]], height = 5, width = 5, units = "in")
}

plist[[1]]
```
## Figure_I
```{r fig.width=5, fig.height=5}
column <- c("x_rotated","y_rotated","Im.L2.3.IT","Im.L4.5.IT","Im.L5.IT","Im.L6.IT","L2.3.IT","L4.5.IT","L5.IT","L6.IT","L5.PT","L5.NP","L6.CT","Lamp5","Pvalb","Sst","Vip","NPC","Astro","Endo","Microglia","Oligo","OPC")
P77_cell2loc <- read.csv("../data/Figure1/P77_cell2location.csv", row.names = 1)
P77_cell2loc <- P77_cell2loc[,column]
colnames(P77_cell2loc) <- c("x_rotated","y_rotated",names(col_SubType))
P77_cell2loc$SubType <- as.character(apply(P77_cell2loc[,names(col_SubType)], 1, function(x){
  names(which.max(x))
}))

data <- P77_cell2loc
Figure_1I <-
  ggplot(data, mapping = aes(x_rotated, y_rotated, color=SubType)) +
  geom_point(size = 0.8) +
  scale_color_manual(values = col_SubType) +
  coord_fixed() +
  theme_void() +
  theme(legend.position = "none")

Figure_1I
```
```{r}
#| eval: false
ggsave("../../Figure/Figure1/Figure_1I.png", plot = Figure_1I,
       height = 5, width = 5, units = "in")
```
## Figure_1J
```{r fig.width=5, fig.height=5}
data <- P77_cell2loc
plist <- list()
for (i in 1:length(col_SubType)){
  subtype_i <- names(col_SubType)[i]
  df_i <- data.frame(
    x = data$x_rotated,
    y = data$y_rotated,
    col = data[,subtype_i]
  )
  df_i$col[df_i$col>1] <- 1
  df_i$col[df_i$col<0.05] <- 0
  plist[[i]] <-
    ggplot(df_i, aes(x=x, y=y, color=col)) +
    geom_point(size=0.8) +
    scale_color_gradient(low = "#f7f7f7", high=col_SubType[i],
                          na.value = "#f7f7f7",
                          limits = c(0,max(df_i$col)),
                          breaks = c(0,max(df_i$col))) +
    coord_fixed() +
    theme_void() +
    theme(legend.position = "none")
  subtype_i <- gsub("/","",subtype_i)
  #ggsave(paste("../../Figure/Figure1/Figure_1J/",i,".P77_",subtype_i,".png",sep=""), plot = plist[[i]], height = 5, width = 5, units = "in")
}
plist[[5]]
```