---
author: "Hu Zheng"
date: "2025-12-01"
date-format: YYYY-MM-DD
---
# Figure4
```{r}
#| warning: false
#| message: false
library(Seurat)
library(tidyverse)
library(scRNAtoolVis)
library(hdWGCNA)
library(patchwork)
library(ggalt)
source('bin/Palettes.R')
```
```{r}
seu.harmony <- readRDS('../data/seu.harmony.rds')
seu.IT <- subset(seu.harmony, cells=colnames(seu.harmony)[which(
  seu.harmony$SubType %in% names(col_SubType)[1:8]
)])
seu.Ex <- seu.harmony[,seu.harmony$SubType %in% names(col_SubType)[1:11]]
```
```{r}
gene_lib <- read.csv('../../data/rds/Figure2/gene_lib.csv')

AG <- unique(str_to_title(gene_lib$Axon_Guidance))
CAM <- unique(str_to_title(gene_lib$CAM))
all_gene <- unique(c(AG, CAM))

# filter
seu <- seu.Ex
all_gene <- all_gene[which(all_gene %in% rownames(seu))]
# gene expression filter
all_gene_exp <- AverageExpression(
  seu, features=all_gene, assays="RNA", slot="data", group.by="SubType"
  )$RNA
all_gene_exp <- as.data.frame(log1p(all_gene_exp))
all_gene_exp$max <- apply(all_gene_exp, 1, max)
# gene cell percentage filter
all_gene_pct <- as.data.frame(t(as.matrix(seu@assays$RNA@data[all_gene,])))
all_gene_pct$SubType <- as.character(seu$SubType)
all_gene_pct <-
  all_gene_pct |>
  dplyr::group_by(SubType) |>
  dplyr::summarize(across(1:length(all_gene), function(x){
    length(which(x>0))/length(x)
    })) |>
  as.data.frame()
rownames(all_gene_pct) <- all_gene_pct$SubType
all_gene_pct <- as.data.frame(t(all_gene_pct[,-1]))
all_gene_pct$max <- apply(all_gene_pct, 1, max)

all_gene <- all_gene[which(all_gene_exp$max>0.1 & all_gene_pct$max>0.1)]
AG <- AG[which(AG %in% all_gene)]
CAM <- CAM[which(CAM %in% all_gene)]
AG <- AG[which(!(AG %in% CAM))]
all_gene <- c(CAM,AG)
```
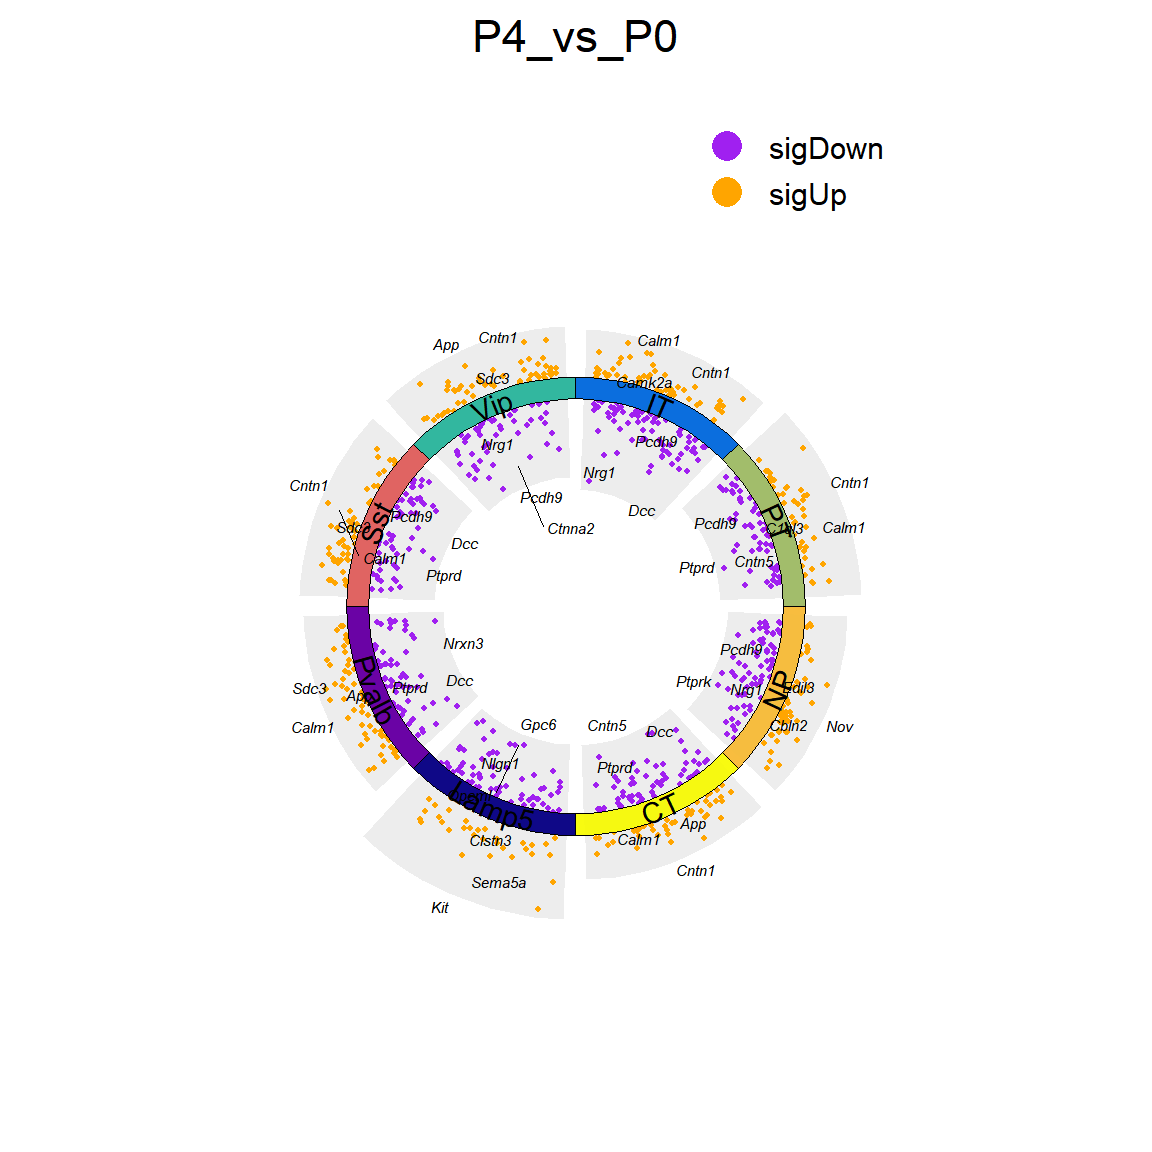
## Figure_4A
```{r}
DEGs_all <- read.csv("../data/Figure2/DEGs_Time_Neuron.csv")
DEGs_all <- DEGs_all[DEGs_all$gene %in% all_gene,]
colnames(DEGs_all)[1] <- "gene"
colnames(DEGs_all)[7] <- "cluster"

P4_cluster <- c("P4_IT","P4_PT","P4_NP","P4_CT","P4_Lamp5","P4_Pvalb","P4_Sst","P4_Vip")
P10_cluster <- c("P10_IT","P10_PT","P10_NP","P10_CT","P10_Lamp5","P10_Pvalb","P10_Sst","P10_Vip")
Adult_cluster <- c("Adult_IT","Adult_PT","Adult_NP","Adult_CT","Adult_Lamp5","Adult_Pvalb","Adult_Sst","Adult_Vip")
P4_vs_P0_DEGs <- DEGs_all[DEGs_all$cluster %in% P4_cluster,]
P10_vs_P4_DEGs <- DEGs_all[DEGs_all$cluster %in% P10_cluster,]
Adult_vs_P10_DEGs <- DEGs_all[DEGs_all$cluster %in% Adult_cluster,]
```
```{r fig.width=6, fig.height=6}
#| message: false
#| warning: false
tile.col <- c("IT"="#0a6ddd","PT"="#a1bc6a","NP"="#f7bc3e","CT"="#f7fa10",
              "Lamp5"="#0e0786","Pvalb"="#6902a4","Sst"="#df6361","Vip"="#31b69e")
P4_vs_P0_DEGs$cluster <- gsub("P4_","",P4_vs_P0_DEGs$cluster)
P4_vs_P0_DEGs$cluster <- factor(P4_vs_P0_DEGs$cluster,
                                levels = names(tile.col))
P4_vs_P0_DEGs <- P4_vs_P0_DEGs[,-1]
Figure_4A <-
  jjVolcano(diffData = P4_vs_P0_DEGs,
          aesCol = c('purple','orange'),
          topGeneN = 3,
          tile.col = tile.col,
          size = 2, segment.size = 0.1,
          fontface = 'italic',
          polar = F,
          seed = 20230727)+
  ylim(-3,3) +
  labs(title = '',x='',y='') +
  theme(plot.title = element_text(hjust = 0.5),
        legend.position = "nine", axis.text.y = element_blank(),
        axis.title.x = element_blank())
Figure_4A
```
```{r}
#| eval: false
ggsave("../../Figure/Figure4/Figure_4A_P4_vs_P0.png", plot = Figure_4A,
       height = 6, width = 6, units = "in")
```
## Figure_4B
```{r}
knitr::include_graphics("./images/Figure_4B.png", dpi = 300)
```
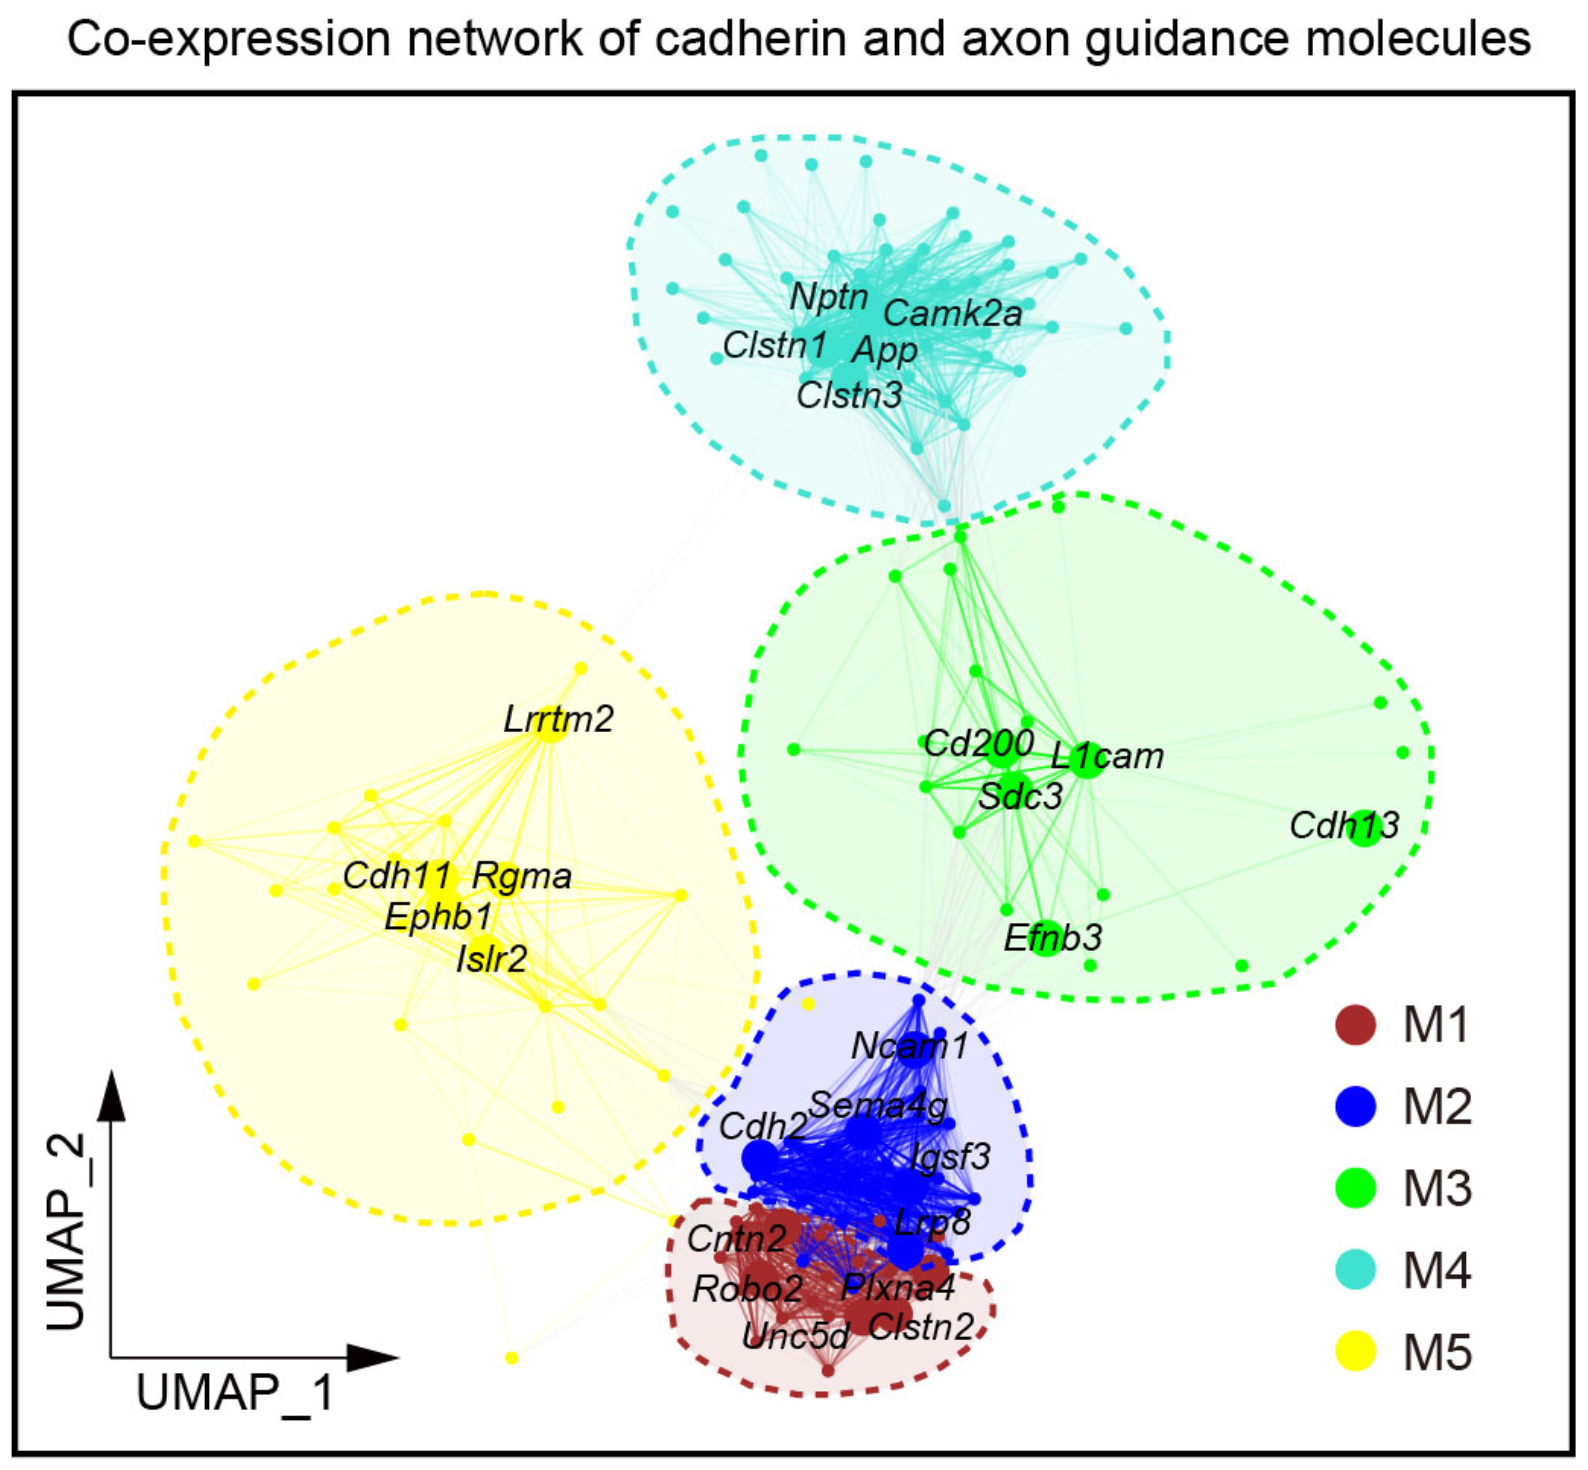
## Figure_4C
```{r}
seurat_obj <- readRDS("../data/Figure4/seu.Ex.hdwgcna.rds")
```
```{r fig.width=6, fig.height=6}
#| warning: false
#| message: false
#| eval: false
set.seed(20241220)
modules <- GetModules(seurat_obj)
mods <- levels(modules$module)
mods <- mods[mods != 'grey']

Figure_4B <-
  HubGeneNetworkPlot(
  seurat_obj,
  n_hubs = 5, n_other=50,
  edge_prop = 0.8,
  edge.alpha = 0.8,
  mods = mods,
  return_graph=FALSE
)
Figure_4B
```
```{r}
knitr::include_graphics("./images/Figure_4C.png", dpi = 300)
```
## Figure_4D
### Figure_4D_1
```{r fig.width=10, fig.height=4}
#| warning: false
#| message: false
plot_list <- ModuleFeaturePlot(
  seurat_obj,
  features='hMEs',
  order=TRUE,
  title = FALSE
)
wrap_plots(plot_list, ncol=5)
```
```{r}
#| eval: false
for (i in 1:5){
  ggsave(filename=paste("../../Figure/Figure4/Figure_4D_1/M",i,".png",sep=""),
         plot_list[[i]],
         width=4, height = 4, units = "in")
}
```
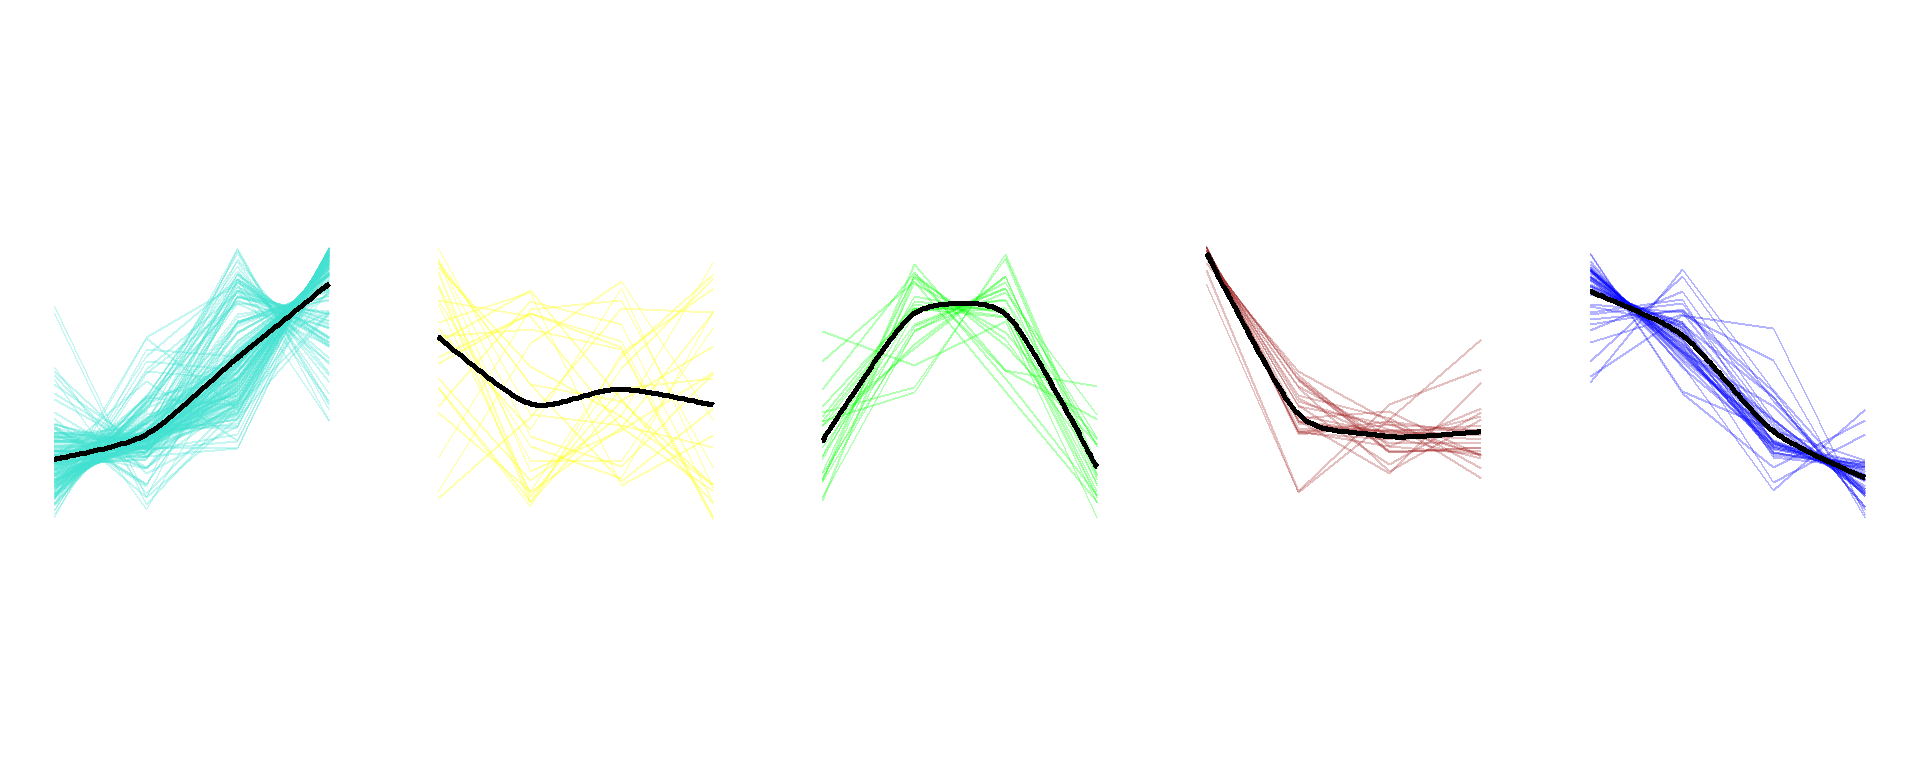
### Figure_4D_2
```{r fig.width=10, fig.height=4}
seurat_obj$Time <- seurat_obj$orig.ident
exp_mean <- AverageExpression(
  seurat_obj,
  features = seurat_obj@misc$CAM_AG$wgcna_genes,
  assays = "RNA",
  slot = "data",
  group.by = "Time")
exp_mean_zscore <- as.data.frame(t(scale(t(exp_mean$RNA))))
exp_mean_zscore$module <- seurat_obj@misc$CAM_AG$wgcna_modules$module
exp_mean_zscore$gene <- rownames(exp_mean_zscore)
exp_mean_zscore <- exp_mean_zscore[which(exp_mean_zscore$module != "grey"),]
exp_mean_long <- pivot_longer(exp_mean_zscore, !c(module,gene), names_to = "Time",
                              values_to = "Exp")

plist <- list()
M_color <- c("M1"="turquoise","M2"="yellow","M3"="green","M4"="brown","M5"="blue")
for (i in 1:5){
  module <- paste("M",i,sep="")
  df <- exp_mean_long[which(exp_mean_long$module==module),]
  df$Time <- factor(df$Time, levels = c("P0","P4","P10","Adult"))
  df_mean <-
    df |>
    group_by(Time) |>
    dplyr::summarize(across(Exp, ~ mean(.x, na.rm = TRUE)))
  df_mean$Time <- factor(df_mean$Time, levels = c("P0","P4","P10","Adult"))

  plist[[i]] <-
    ggplot(df, aes(x=Time, y=Exp)) +
    geom_line(aes(group=gene), color=M_color[i], alpha=0.3) +
    stat_xspline(df_mean, mapping=aes(x=Time, y=Exp, group=1),
               spline_shape=-0.4, color="black", linewidth=1) +
    theme_void(base_size = 10) +
    theme(plot.title = element_text(hjust = 0.5),
          panel.grid = element_blank()) +
    scale_y_continuous(limits = c(-1.5,1.5)) +
    coord_fixed()
  #ggsave(filename=paste("../../Figure/Figure4/Figure_4D_2/M",i,".png",sep=""),
  #       plist[[i]],
  #       width=4, height = 4, units = "in")
}

cowplot::plot_grid(plotlist = plist, ncol = 5)
```
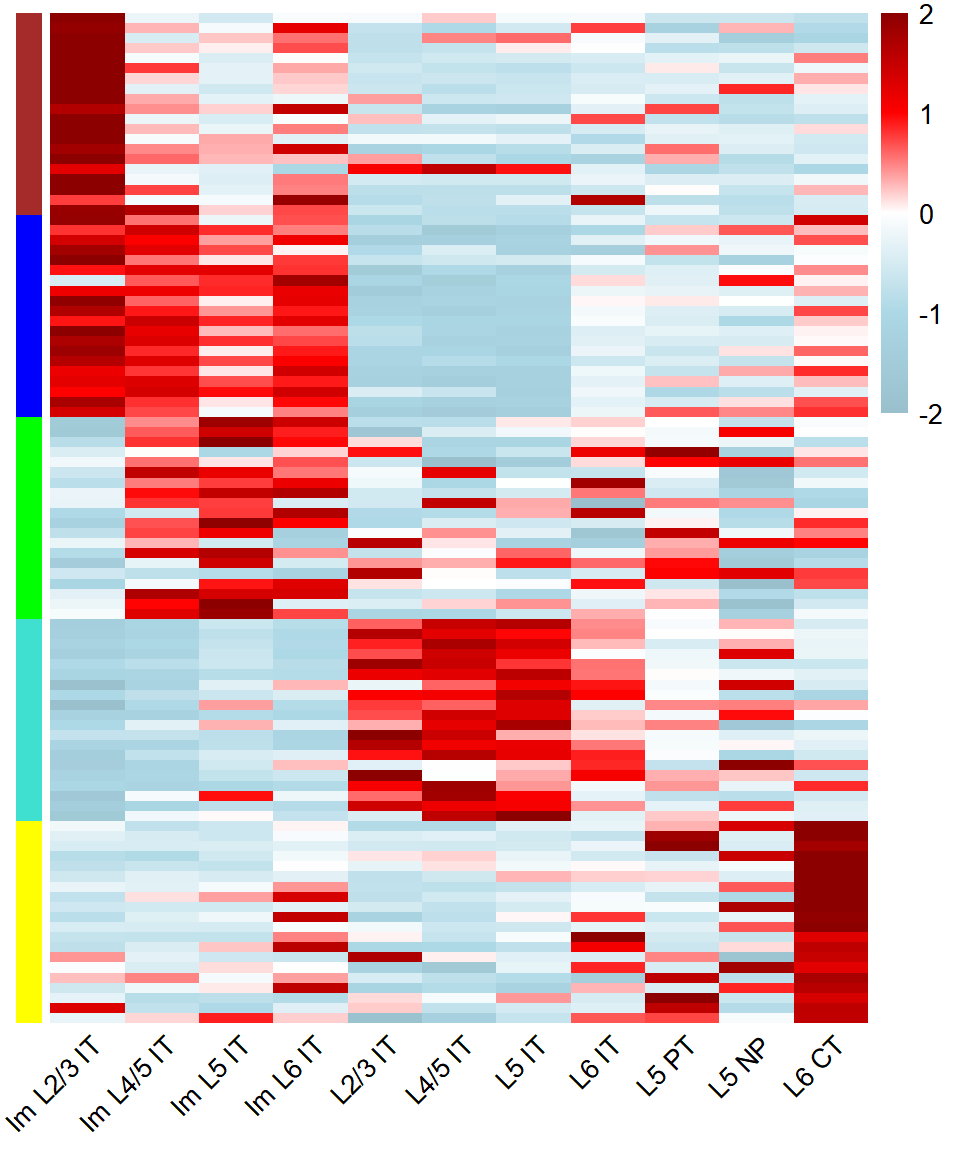
### Figure_4D_3
```{r fig.width=5, fig.height=6}
SubType_order <- names(col_SubType)[1:11]
M_order <- c("M4","M5","M3","M1","M2")
M_color <- c("M1"="turquoise","M2"="yellow","M3"="green","M4"="brown","M5"="blue")

hub_df <- GetHubGenes(seurat_obj, n_hubs = 20)
hub_df$module <- factor(hub_df$module, levels = M_order)
hub_df <- hub_df[order(hub_df$module),]

seurat_obj$Cluster <- seurat_obj$SubType_v4

exp_mean <- AverageExpression(
  seurat_obj,
  features = hub_df$gene_name,
  assays = "RNA",
  slot = "data",
  group.by = "Cluster")
exp_mean_zscore <- as.data.frame(t(scale(t(exp_mean$RNA))))

annotation_row = data.frame(
  Module = rep(M_order,each=20)
)
rownames(annotation_row) <- rownames(exp_mean_zscore)
ann_colors = list(
  Module = M_color
)

breaks <- seq(-2,2,0.01)
col <- colorRampPalette(c("lightblue3", "lightblue", "white", "red", "red4"))(length(breaks))

mat <- exp_mean_zscore[,SubType_order]
mat[mat>2] <- 2
mat[mat< -2] <- -2
Figure_4D_3 <-
  pheatmap::pheatmap(mat,
         cluster_rows = F, cluster_cols = F,
         breaks = breaks,
         color = col,
         fontsize_col = 10,
         annotation_row = annotation_row,
         annotation_colors = ann_colors,
         annotation_names_row=F, annotation_names_col=F, annotation_legend=F,
         show_colnames = T, show_rownames = F, angle_col=45, border_color=NA
         )
```
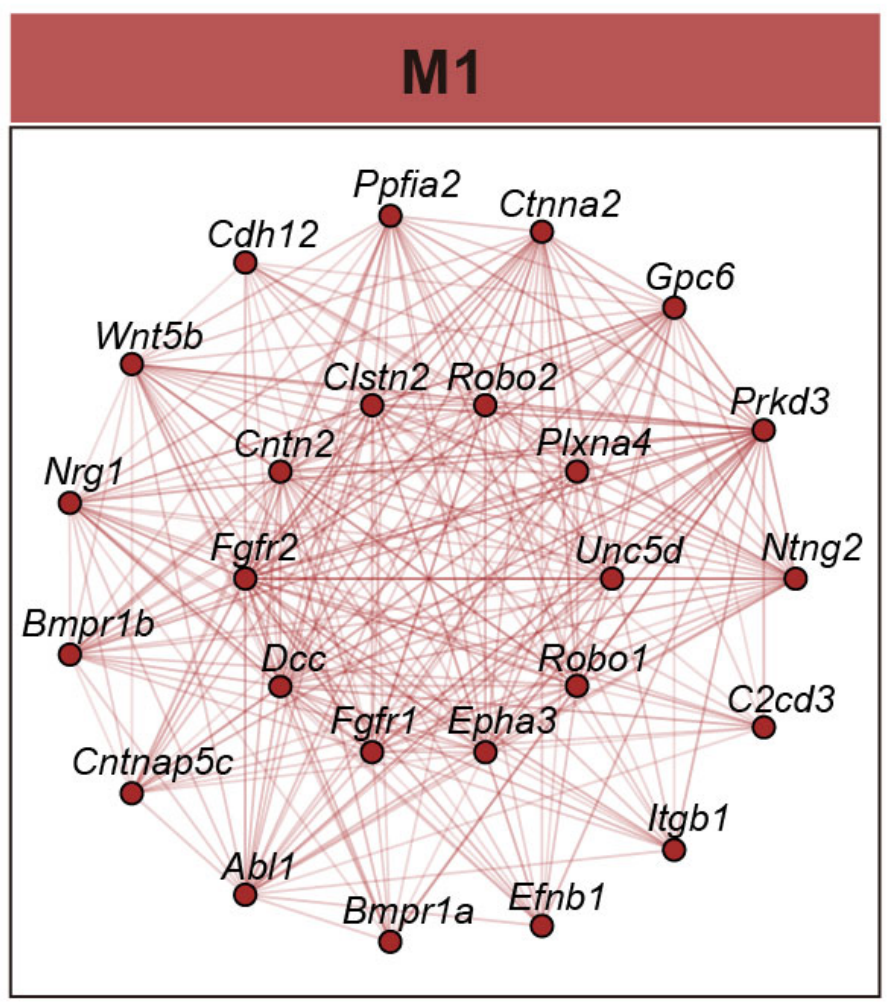
## Figure_4E
```{r}
#| eval: false
ModuleNetworkPlot(
  seurat_obj,
  outdir = '../../Figure/Figure4/ModuleNetwork'
)
```
```{r}
knitr::include_graphics("./images/Figure_4E.png", dpi = 300)
```
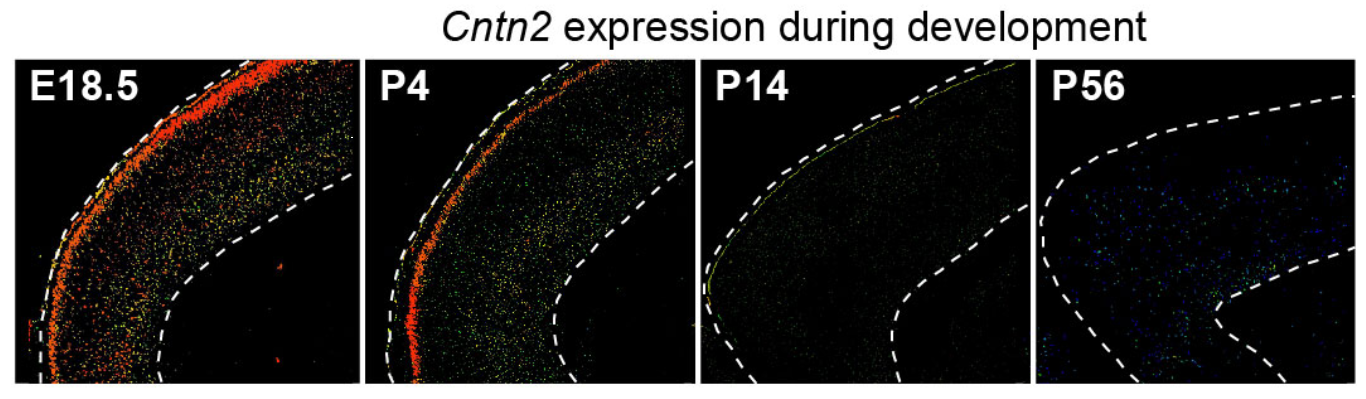
## Figure_4F
```{r fig.width=6, fig.height=6}
#| message: false
seu <- seu.IT
seu$orig.ident <- factor(seu$orig.ident, levels = c("P1","P4","P10","Adult"))
gene_list <- c("Unc5d","Plxna4","Robo2","Clstn2","Cntn2")

Figure_4F <-
  VlnPlot(seu, features = rev(gene_list), group.by = "orig.ident", cols=col_Time,
        split.by = "orig.ident",
        stack = TRUE, flip = TRUE) +
  theme(legend.position = "none", axis.text.x = element_text(angle = 0, hjust = 0.5)) +
  labs(x="")
Figure_4F
```
```{r}
#| eval: false
ggsave("../../Figure/Figure4/Figure_4F.pdf", plot = Figure_4F,
       height = 6, width = 6, units = "in")
```
## Figure_4G
```{r}
knitr::include_graphics("./images/Figure_4G.png", dpi = 300)
```