# Install packages
if (!requireNamespace("RIdeogram", quietly = TRUE)) {
  install.packages("RIdeogram")
}

# Load packages
library(RIdeogram)Collinearity Plot
Collinearity plot is often used to compare genome sequences of different species, identify conserved homologous gene blocks and their arrangement order, and reveal changes in chromosome structure during evolution. This plot is widely used in the study of genome evolution, functional gene localization, and species relationship analysis.
Example
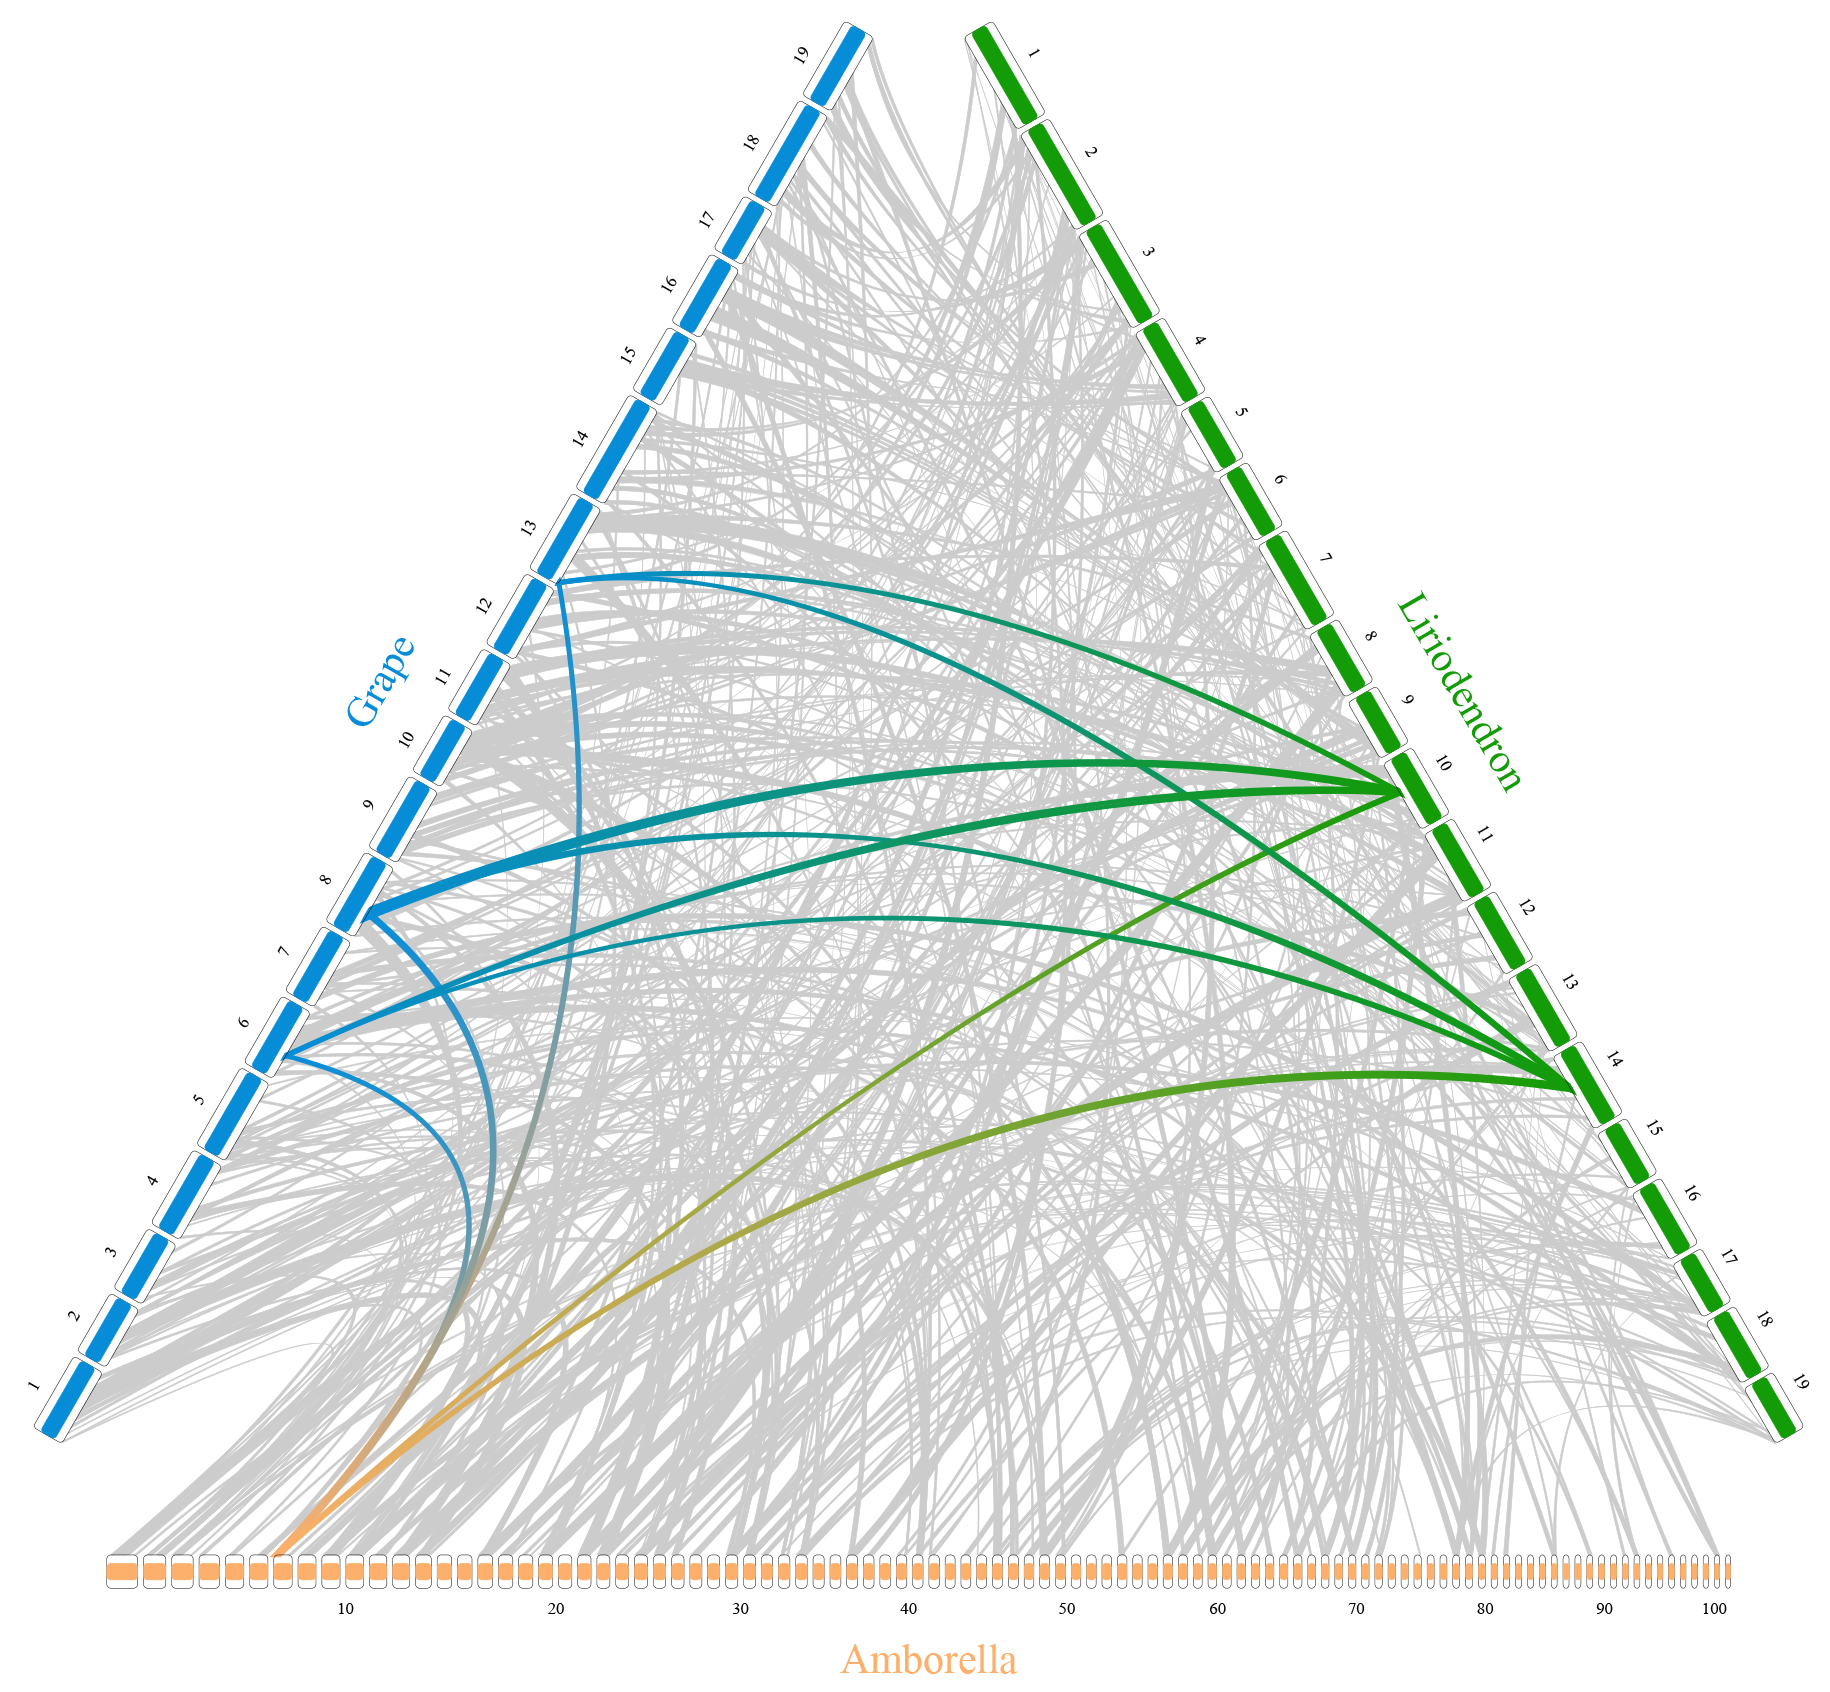
This plot is a colinearity diagram of the ternary genome, where Amborella, Grape, and Liriodendron represent three different species, the long bars represent genomes, the numbers are chromosome numbers, and the lines represent the comparison between the genomes of different species. The highlighted lines represent the comparison of the genomic regions of interest.
Setup
System Requirements: Cross-platform (Linux/MacOS/Windows)
Programming language: R
Dependent packages:
RIdeogram
Data Preparation
We import the sample data provided in the RIdeogram package. karyotype_ternary_comparison contains different species and genome information, and synteny_ternary_comparison contains genome comparison information between different species.
data(karyotype_ternary_comparison, package="RIdeogram")
data(synteny_ternary_comparison, package="RIdeogram")
# View karyotype_ternary_comparison data structure
head(karyotype_ternary_comparison) Chr Start End fill species size color
1 NA 1 15980527 fcb06b Amborella 10 fcb06b
2 NA 1 11522362 fcb06b Amborella 10 fcb06b
3 NA 1 11085951 fcb06b Amborella 10 fcb06b
4 NA 1 10537363 fcb06b Amborella 10 fcb06b
5 NA 1 9585472 fcb06b Amborella 10 fcb06b
6 NA 1 9414115 fcb06b Amborella 10 fcb06b# View synteny_ternary_comparison data structure
head(synteny_ternary_comparison) Species_1 Start_2 End_2 Species_2 Start_1 End_1 fill type
1 1 4761181 2609697 1 342802 981451 cccccc 1
2 6 6344197 8074393 1 15387184 16716190 cccccc 1
3 10 6457890 9052487 1 11224953 14959548 cccccc 1
4 13 6318795 1295413 1 20564870 21386271 cccccc 1
5 16 1398101 2884119 1 21108654 22221088 cccccc 1
6 16 1482529 2093625 1 21864494 22364888 cccccc 1Visualization
1. Basic Collinearity Plot
You can use the ideogram function provided in the RIdeogram package to draw a collinearity plot.
# Basic Collinearity Plot
ideogram(karyotype = karyotype_ternary_comparison, synteny = synteny_ternary_comparison)
convertSVG("chromosome.svg", device = "png")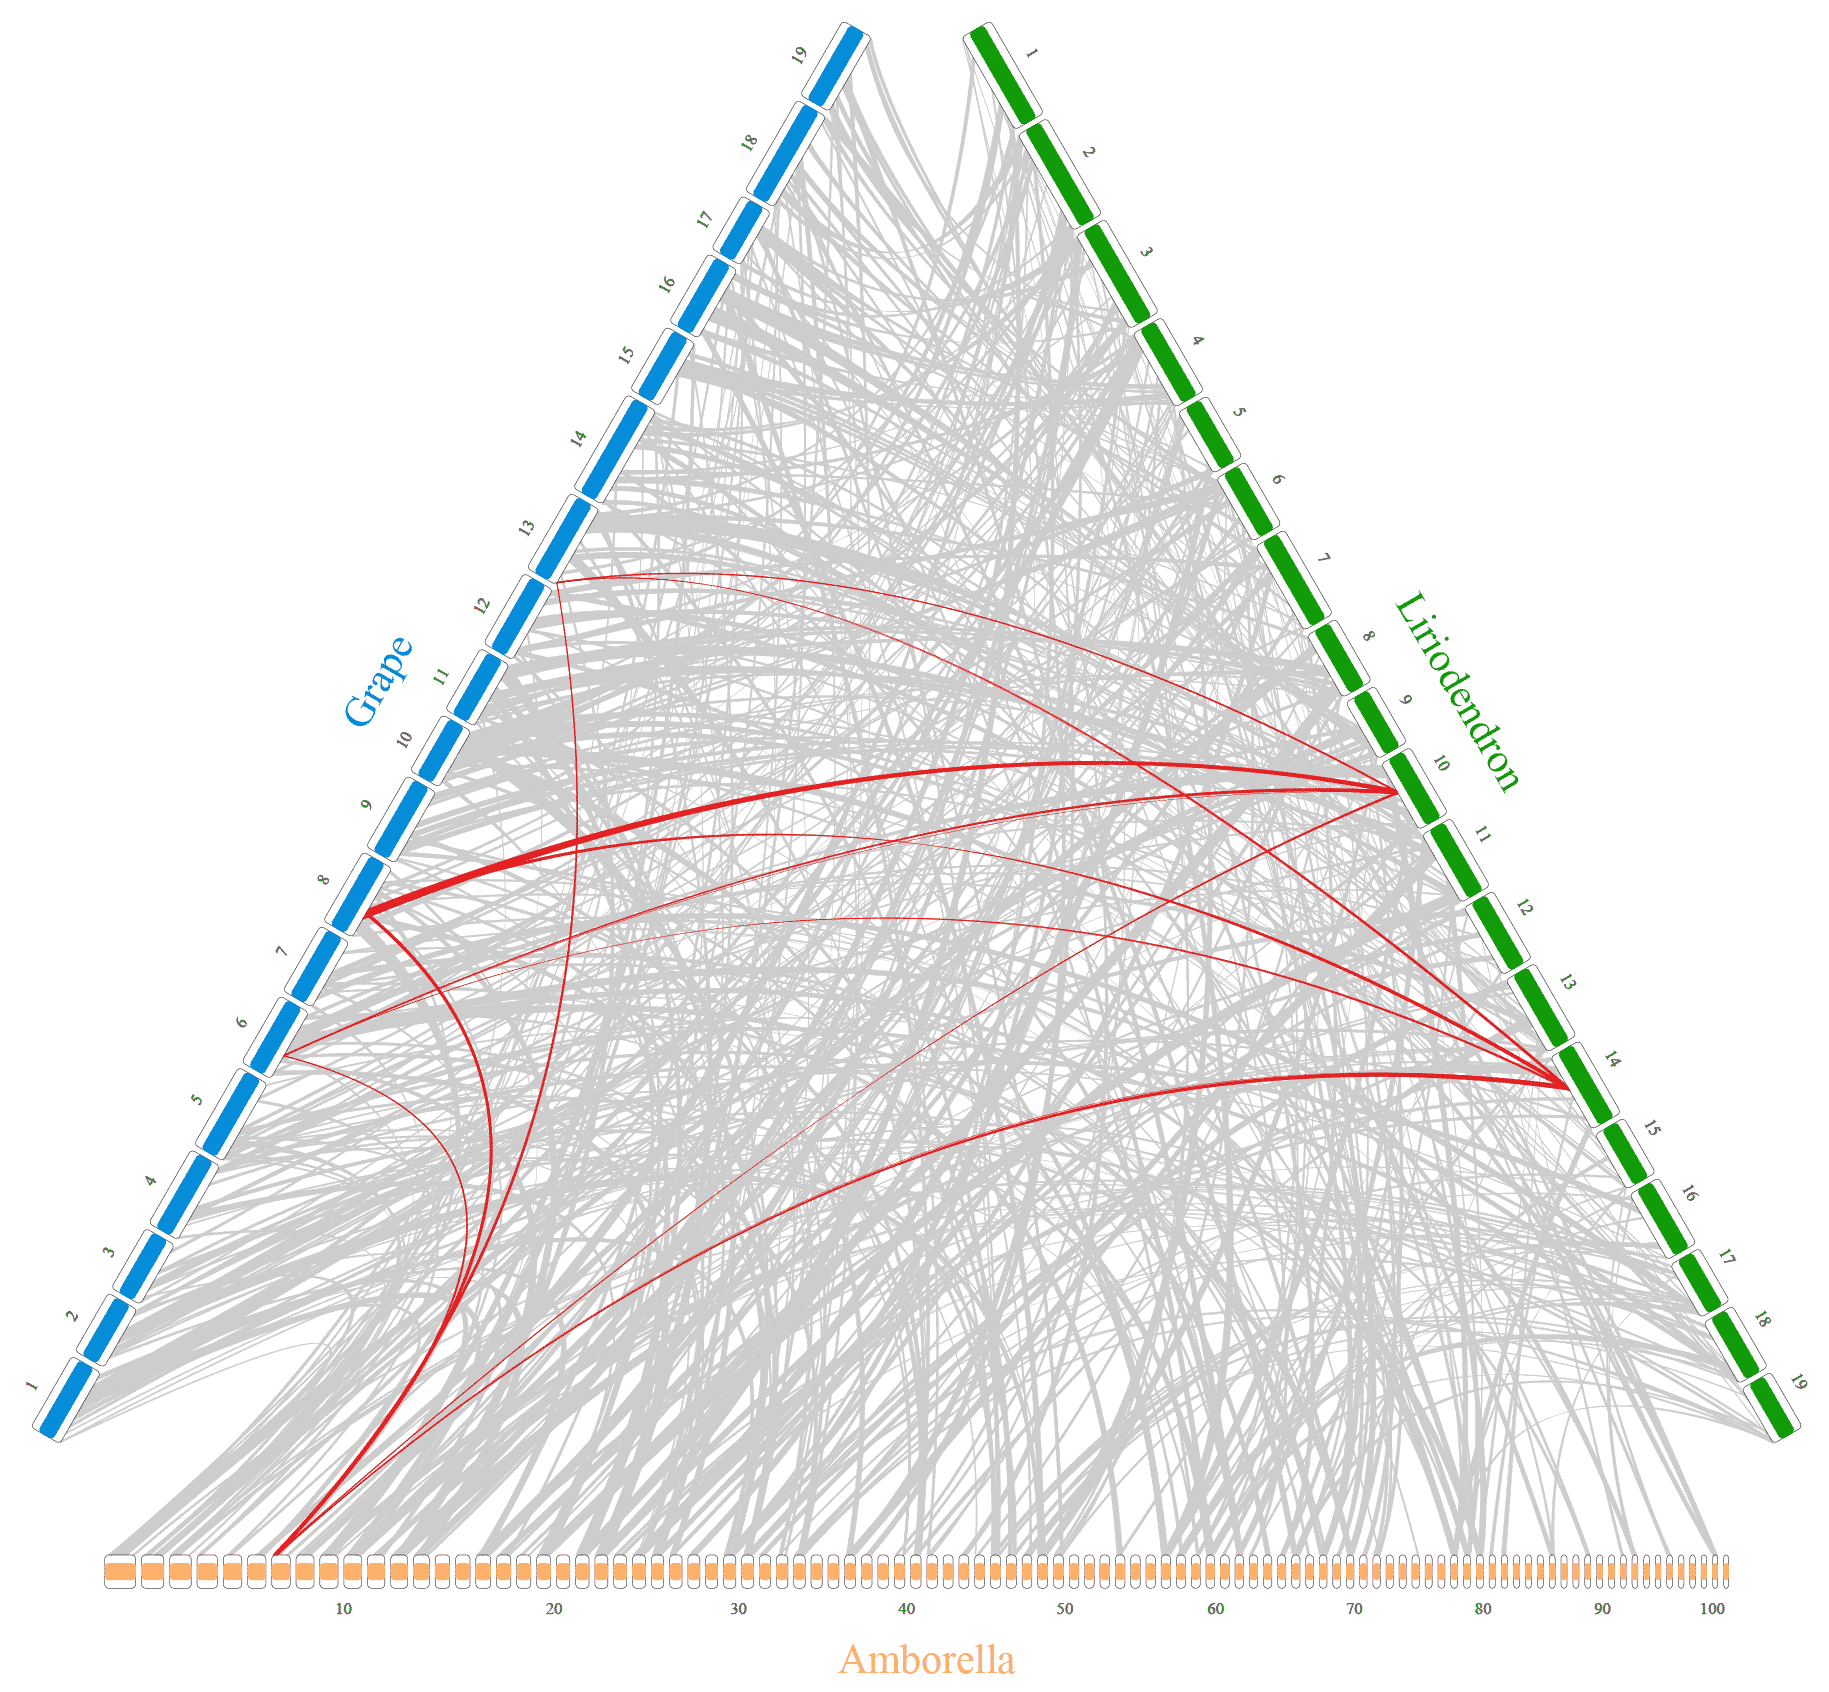
Tip
Key Parameters:
-
karyotype: A table containing information about different species and their genomes. The data structure is shown in
karyotype_ternary_comparison. -
overlaid: A table containing genome comparison information between different species. The data structure is shown in
synteny_ternary_comparison.
2. Change Colors
If you want to change the colors of the plot, just modify the color column in the karyotype and overlaid tables. As shown below, we modify the color and fill columns in the karyotype_ternary_comparison table, and the fill column in the synteny_ternary_comparison.
# Change the colors of three species
change_color1 <- c("fcb06b"="ff0000", "078dd8"="00ff00", "139b08"="0000ff")
karyotype_ternary_comparison$color <- as.character(change_color1[karyotype_ternary_comparison$color])
karyotype_ternary_comparison$fill <- as.character(change_color1[karyotype_ternary_comparison$fill])

# Change the line color
change_color2 <- c("cccccc"="add8e6", "e41a1c"="8b0000")
synteny_ternary_comparison$fill <- as.character(change_color2[synteny_ternary_comparison$fill])

# Plot
ideogram(karyotype = karyotype_ternary_comparison, synteny = synteny_ternary_comparison)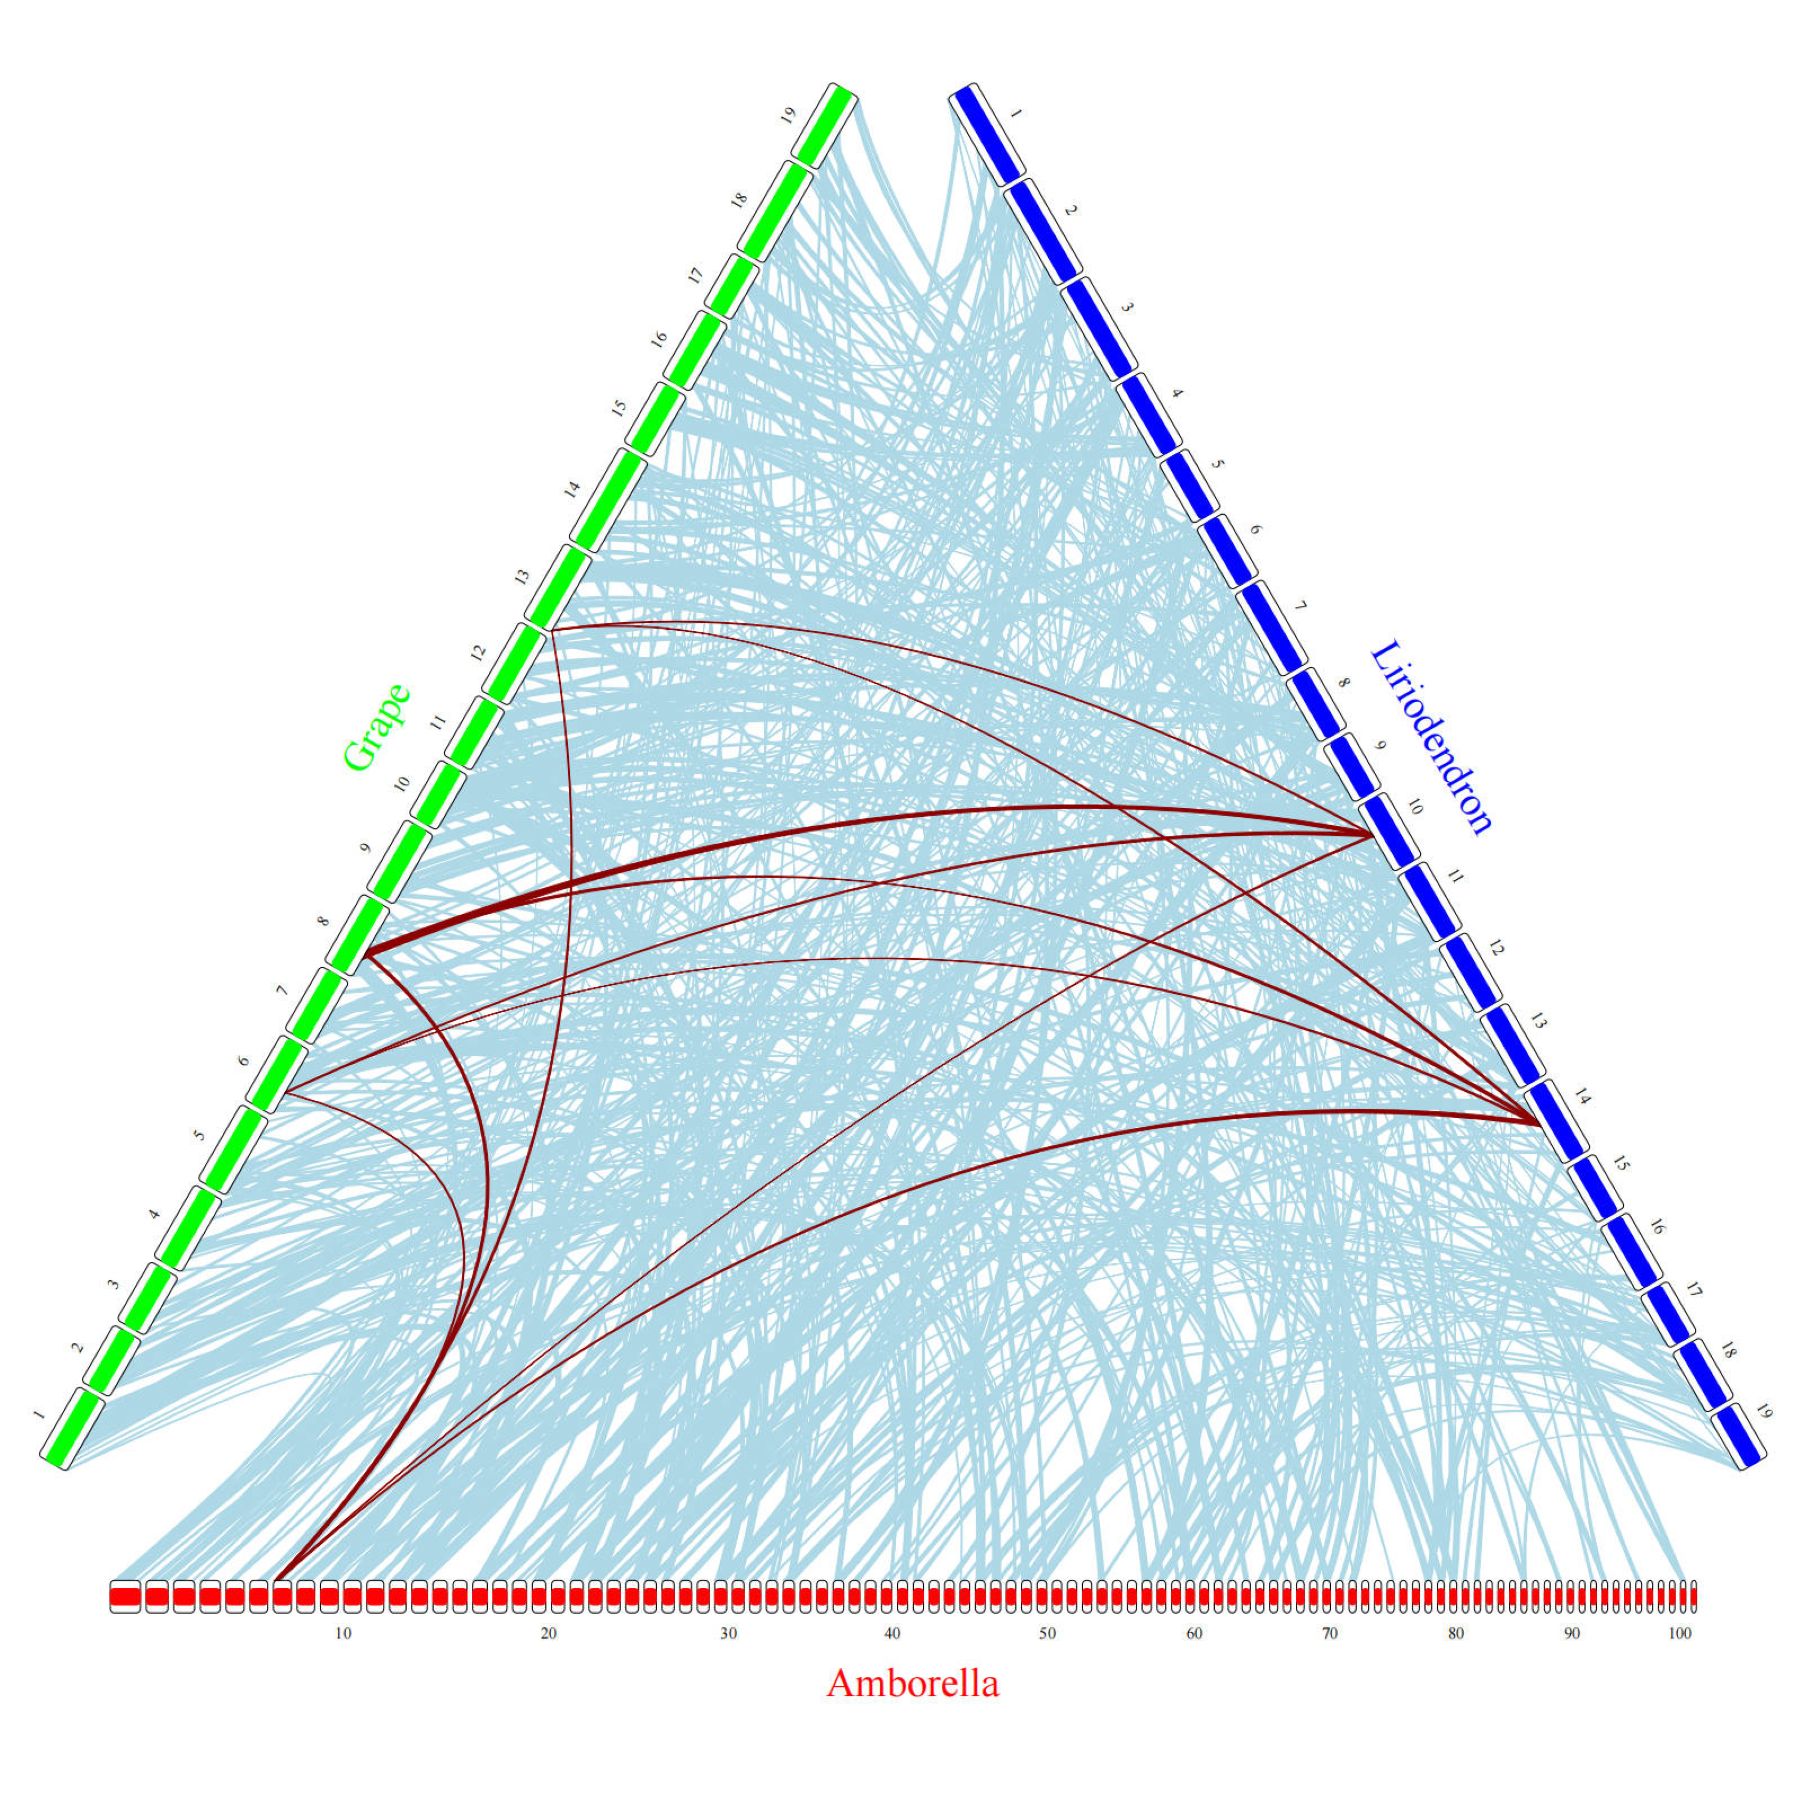
Application
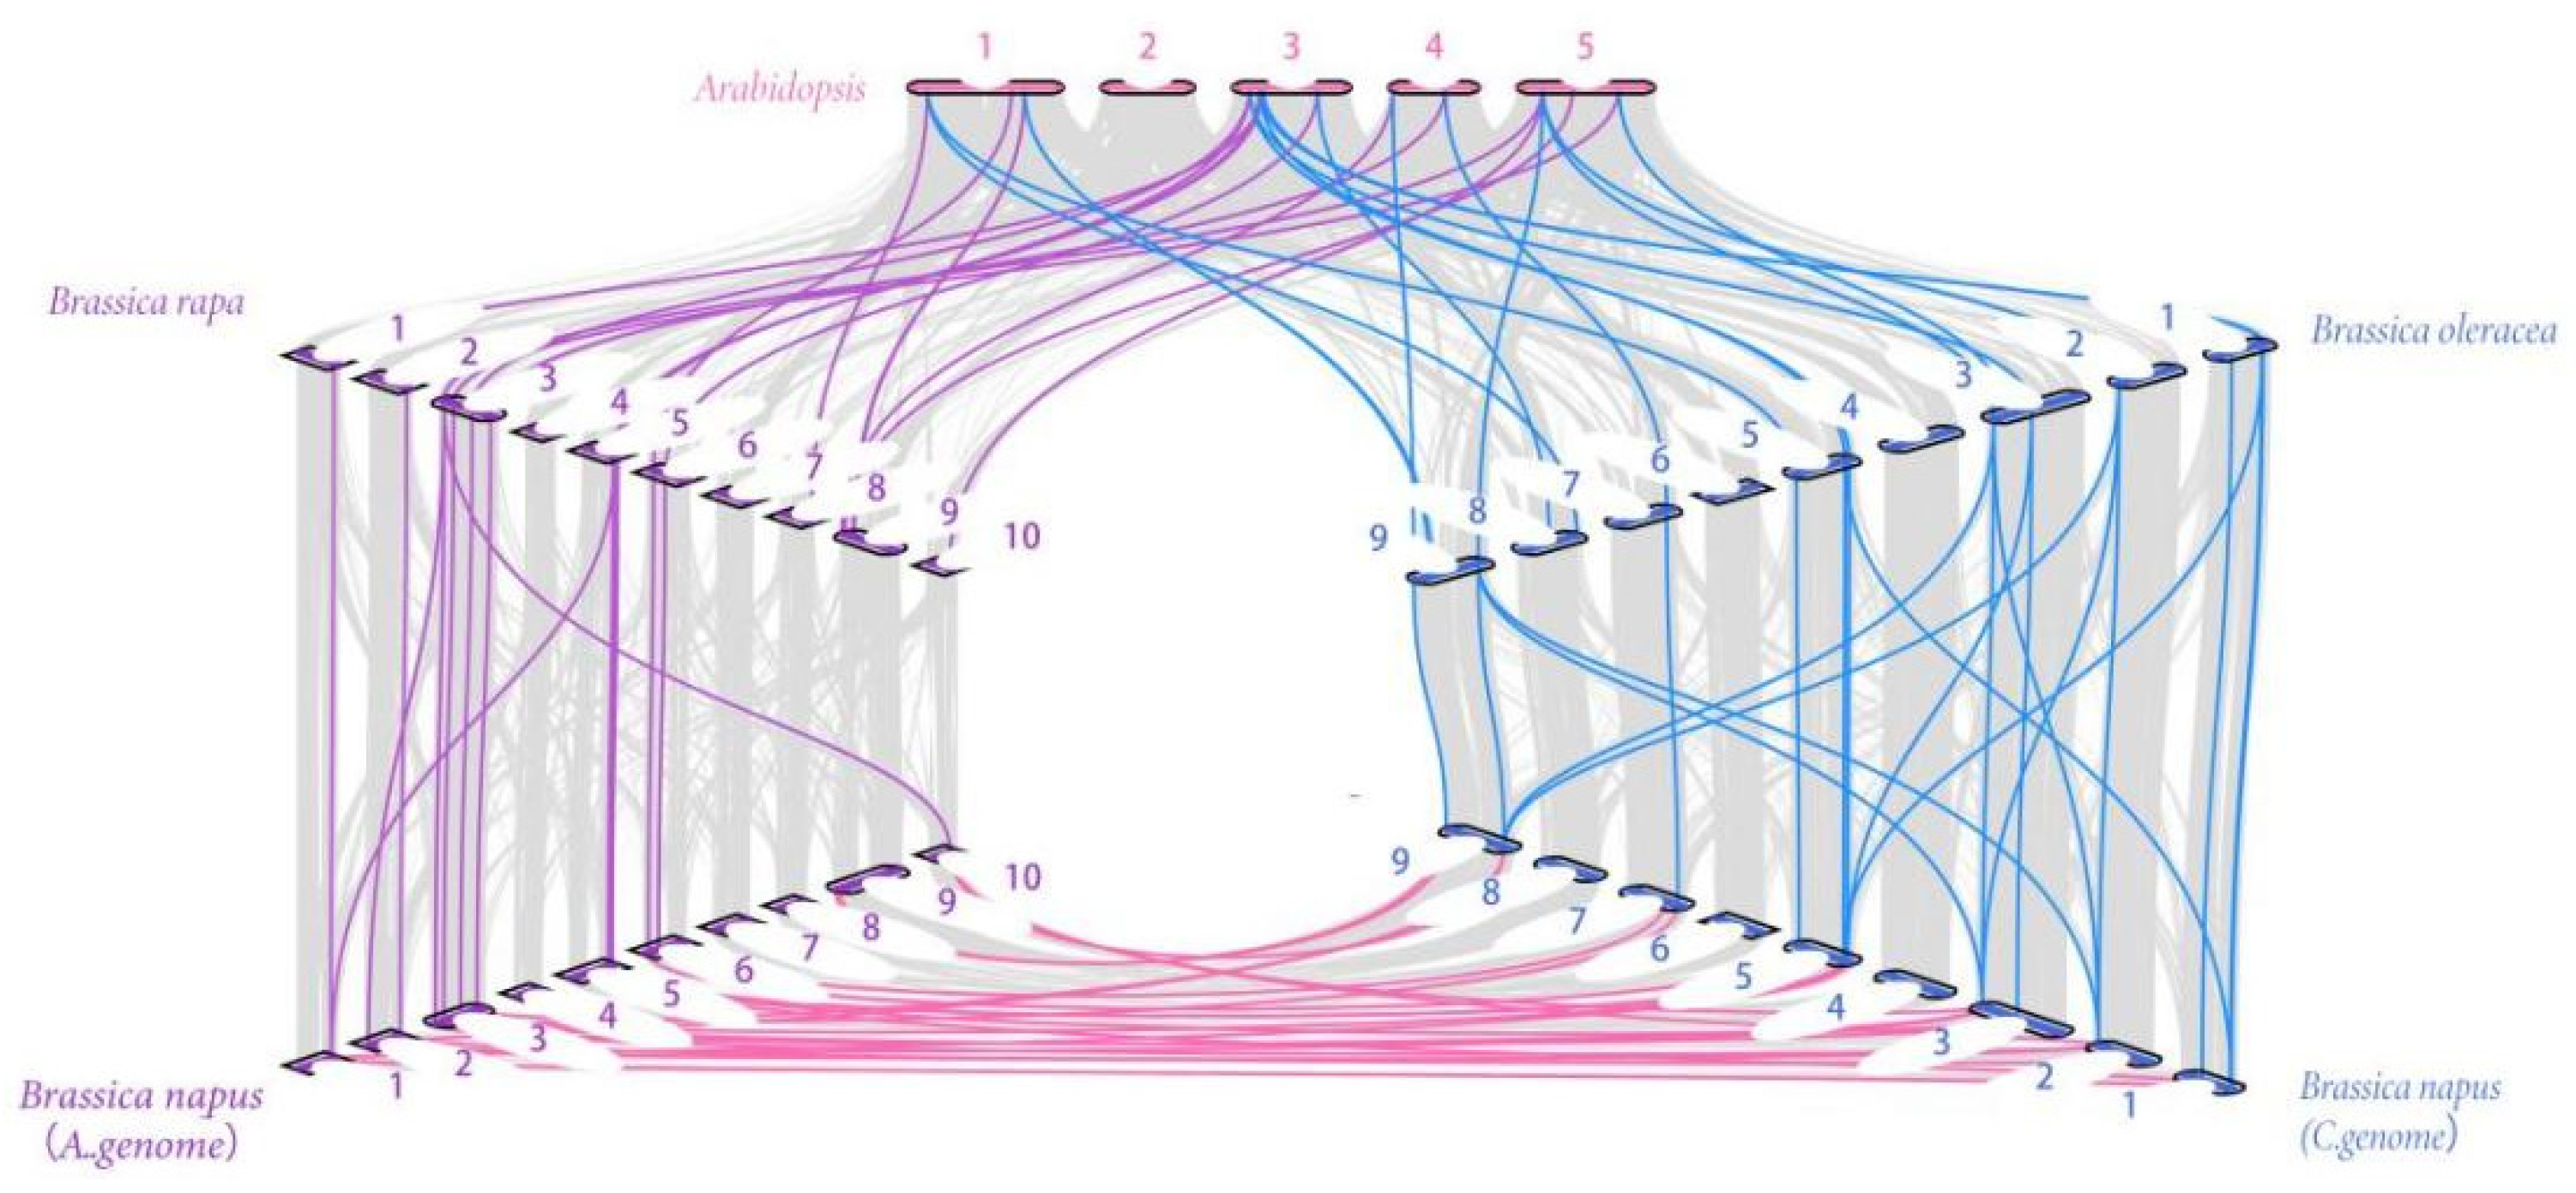
This figure shows the homology of R2R3-MYB genes in B. napus and three ancestral plant species. The figure shows the colinearity between Arabidopsis (A. thaliana), Brassica rapa (B. rapa), Brassica oleracea (B. oleracea), Brassica napus (B. napus).[1]
Reference
[1] Luo D, Mei D, Wei W, Liu J. Identification and Phylogenetic Analysis of the R2R3-MYB Subfamily in Brassica napus. Plants (Basel). 2023;12(4):886. Published 2023 Feb 16. doi:10.3390/plants12040886