# Install packages
if (!requireNamespace("ggplot2", quietly = TRUE)) {
  install.packages("ggplot2")
}
if (!requireNamespace("reshape2", quietly = TRUE)) {
  install.packages("reshape2")
}
if (!requireNamespace("ggthemes", quietly = TRUE)) {
  install.packages("ggthemes")
}

# Load packages
library(ggplot2)
library(reshape2)
library(ggthemes)Multiple Barplot&Line
Note
Hiplot website
This page is the tutorial for source code version of the Hiplot Multiple Barplot&Line plugin. You can also use the Hiplot website to achieve no code ploting. For more information please see the following link:
Displaying multiple bar or line plot in one diagram.
Setup
System Requirements: Cross-platform (Linux/MacOS/Windows)
Programming language: R
Dependent packages:
ggplot2;reshape2;ggthemes
Data Preparation
Data frame with multiple columns data (Numeric).
# Load data
data <- read.table("files/Hiplot/009-barplot-line-multiple-data.txt", header = T)

# convert data structure
data_melt <- melt(data, id.vars = colnames(data)[1])
data_melt[, 1] <- factor(data_melt[, 1], level = unique(data_melt[, 1]))

# View data
head(data)
age height weight math biology english chinese
1 12 158 100 120 90 115 140
2 15 160 110 145 80 120 120
3 18 175 120 132 95 118 110
4 20 176 121 124 99 118 136
5 21 176 120 135 98 114 150
6 22 177 124 140 87 110 150Visualization
1. Multiple Line
# Multiple Line
p <- ggplot(data = data_melt, aes(x = age, y = value, group = variable,
                                  colour = variable)) +
  geom_line(alpha = 1, size = 1) +
  geom_point(aes(shape = variable), alpha = 1, size = 3) +
  labs(title = "Line (Multiple)", x = "X Lable", y = "Value") +
  scale_color_manual(values = c("#3B4992FF","#EE0000FF","#008B45FF","#631879FF",
                               "#008280FF","#BB0021FF")) +
  theme_stata() +
  theme(text = element_text(family = "Arial"),
        plot.title = element_text(size = 12,hjust = 0.5),
        axis.title = element_text(size = 12),
        axis.text = element_text(size = 10),
        axis.text.x = element_text(angle = 0, hjust = 0.5,vjust = 1),
        legend.position = "right",
        legend.direction = "vertical",
        legend.title = element_text(size = 10),
        legend.text = element_text(size = 10))

p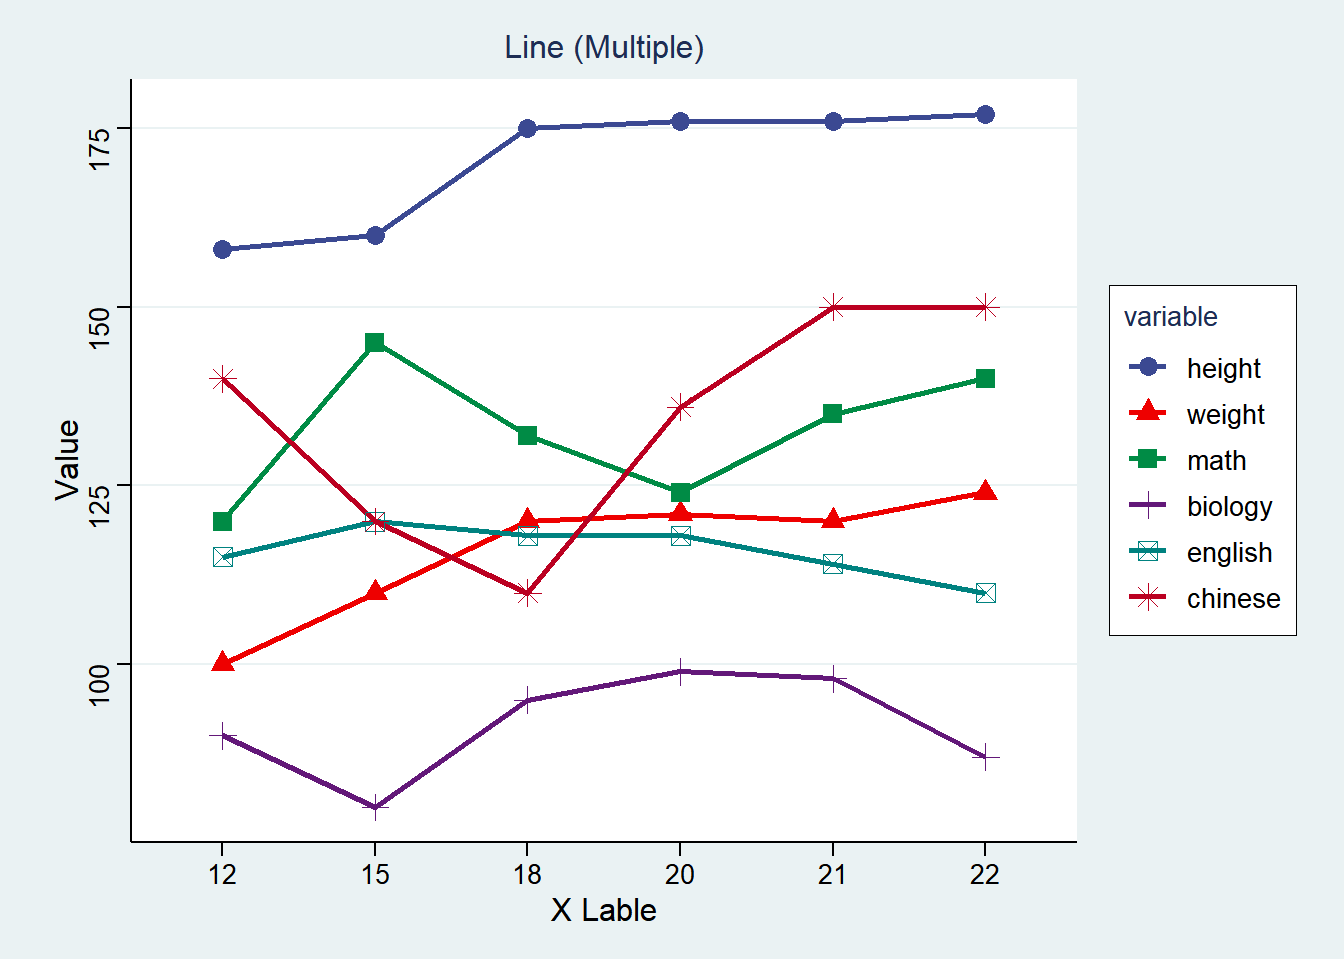
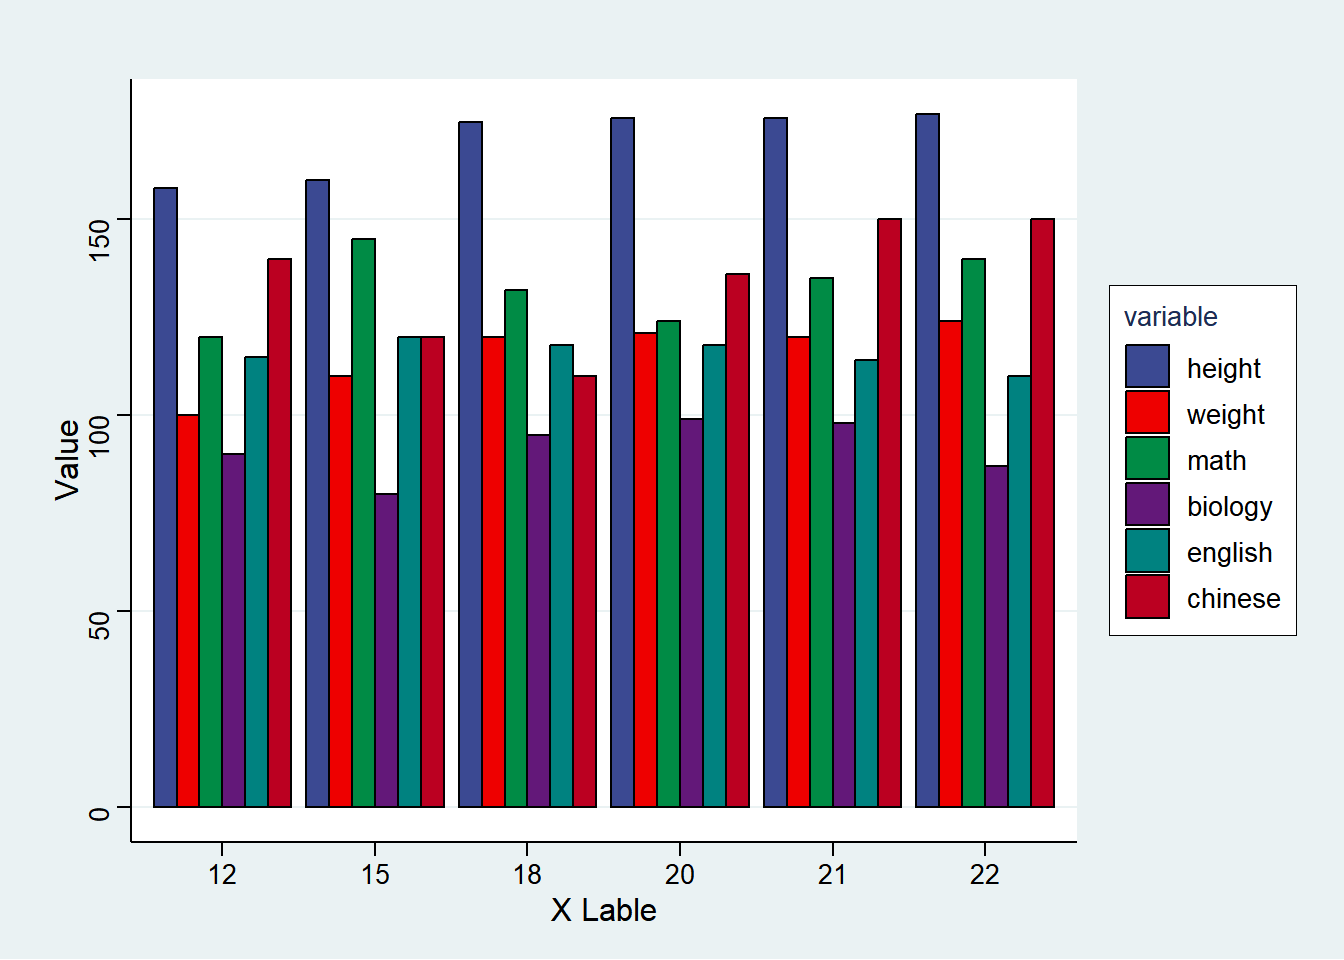
2. Multiple Barplot
# Multiple Barplot
p <- ggplot(data = data_melt, aes(x = age, y = value, fill = variable)) +
  geom_bar(stat = "identity", position = position_dodge(), colour = "black",
           alpha = 1) +
  labs(title = "", x = "X Lable", y = "Value") +

  scale_fill_manual(values = c("#3B4992FF","#EE0000FF","#008B45FF","#631879FF",
                               "#008280FF","#BB0021FF")) +
  theme_stata() +
  theme(text = element_text(family = "Arial"),
        plot.title = element_text(size = 12,hjust = 0.5),
        axis.title = element_text(size = 12),
        axis.text = element_text(size = 10),
        axis.text.x = element_text(angle = 0, hjust = 0.5,vjust = 1),
        legend.position = "right",
        legend.direction = "vertical",
        legend.title = element_text(size = 10),
        legend.text = element_text(size = 10))

p