# 安装包
if (!requireNamespace("GGally", quietly = TRUE)) {
  install.packages("GGally")
}

# 加载包
library(GGally)双变量图
注记
Hiplot 网站
本页面为 Hiplot Bivariate Chart 插件的源码版本教程,您也可以使用 Hiplot 网站实现无代码绘图,更多信息请查看以下链接:
展示双变量关系。
环境配置
系统: Cross-platform (Linux/MacOS/Windows)
编程语言: R
依赖包:
GGally
数据准备
# 加载数据
data <- read.table("files/Hiplot/014-bivariate-data.txt", header = T)

# 查看数据
head(data)
total_bill tip gender smoker day time size
1 16.99 1.01 Female No Sun Dinner 2
2 10.34 1.66 Male No Sun Dinner 3
3 21.01 3.50 Male No Sun Dinner 3
4 23.68 3.31 Male No Sun Dinner 2
5 24.59 3.61 Female No Sun Dinner 4
6 25.29 4.71 Male No Sun Dinner 4可视化
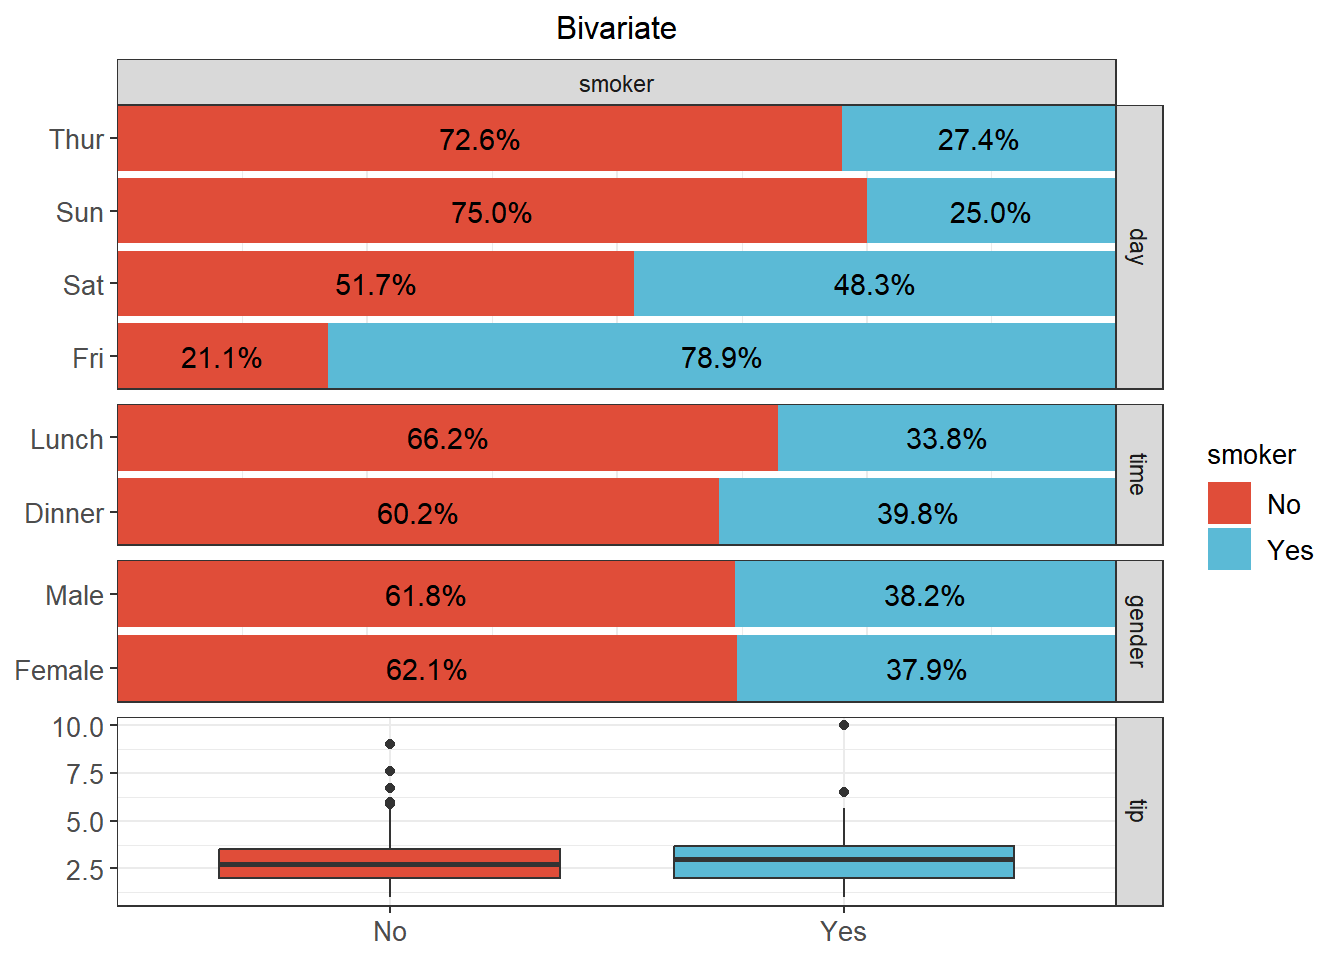
# 双变量图
p <- ggbivariate(data, outcome = "smoker",
                 explanatory = c("day","time","gender","tip")) +
  ggtitle("Bivariate") +
  scale_fill_manual(values = c("#e04d39","#5bbad6")) +
  theme_bw() +
  theme(text = element_text(family = "Arial"),
        plot.title = element_text(size = 12,hjust = 0.5),
        axis.title = element_text(size = 12),
        axis.text = element_text(size = 10),
        axis.text.x = element_text(angle = 0, hjust = 0.5),
        legend.position = "right",
        legend.direction = "vertical",
        legend.title = element_text(size = 10),
        legend.text = element_text(size = 10))

p