# 安装包
if (!requireNamespace("ggplot2", quietly = TRUE)) {
  install.packages("ggplot2")
}
if (!requireNamespace("ggbump", quietly = TRUE)) {
  install.packages("ggbump")
}
if (!requireNamespace("dplyr", quietly = TRUE)) {
  install.packages("dplyr")
}

# 加载包
library(ggplot2)
library(ggbump)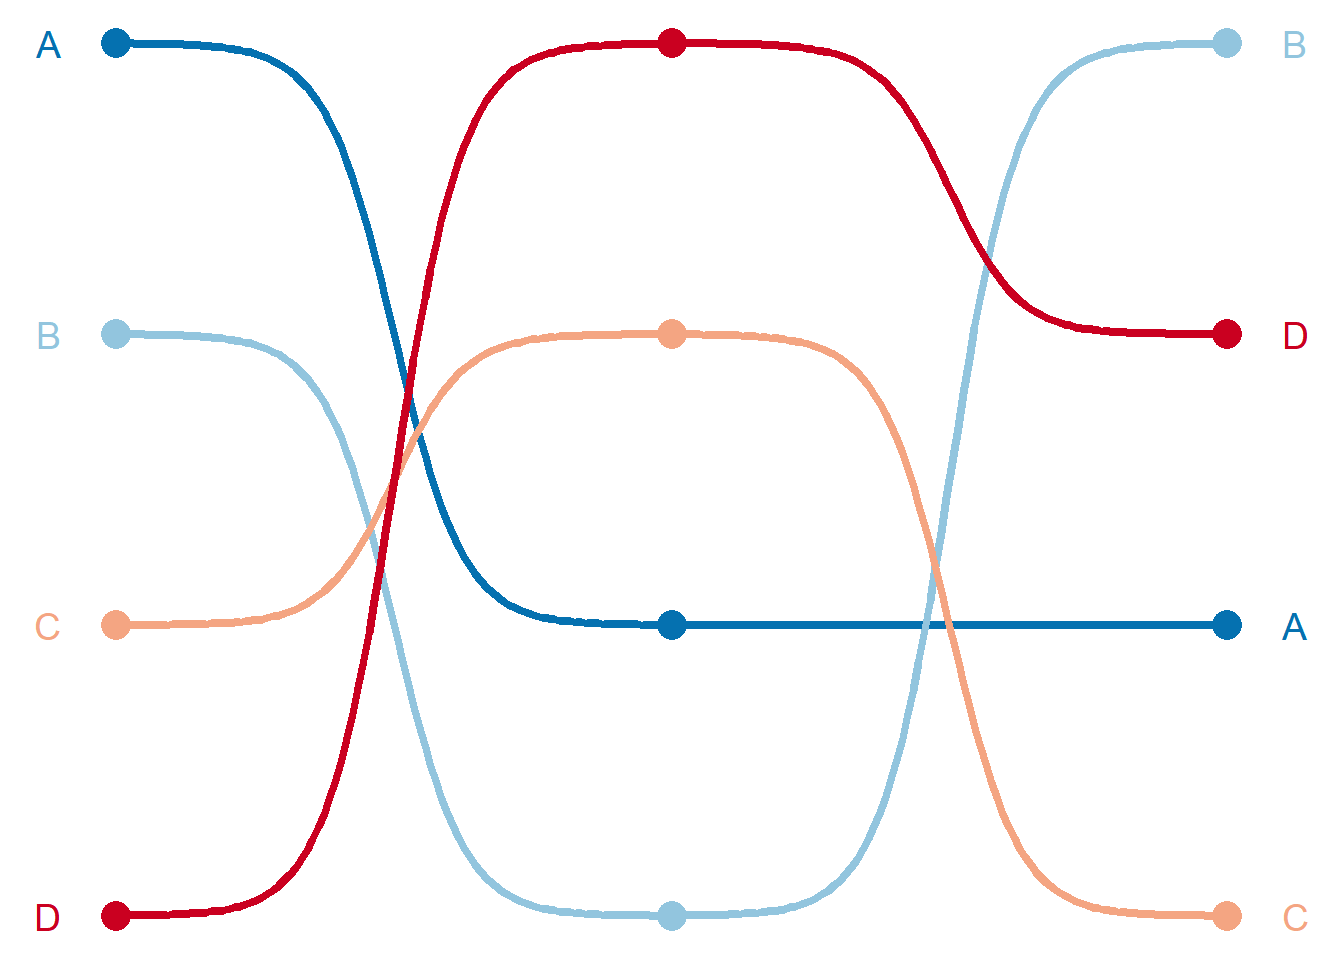
library(dplyr)凹凸图
注记
Hiplot 网站
本页面为 Hiplot Bumpchart 插件的源码版本教程,您也可以使用 Hiplot 网站实现无代码绘图,更多信息请查看以下链接:
凹凸图可以用于展示多组数值变化情况。
环境配置
系统: Cross-platform (Linux/MacOS/Windows)
编程语言: R
依赖包:
ggplot2;ggbump;dplyr
数据准备
# 加载数据
data <- read.table("files/Hiplot/017-bumpchart-data.txt", header = T)

# 查看数据
head(data)
x y group
1 2019 4 A
2 2020 2 A
3 2021 2 A
4 2019 3 B
5 2020 1 B
6 2021 4 B可视化
# 凹凸图
p <- ggplot(data, aes(x = x, y = y, color = group)) +
  geom_bump(size = 1.5) +
  geom_point(size = 5) +
  geom_text(data = data %>% filter(x == min(x)),
            aes(x = x - 0.1, label = group),
            size = 5, hjust = 1) +
  geom_text(data = data %>% filter(x == max(x)),
            aes(x = x + 0.1, label = group),
            size = 5, hjust = 0) +
  theme_void() +
  theme(legend.position = "none") +
  scale_color_manual(values = c("#0571B0","#92C5DE","#F4A582","#CA0020"))

p