# 安装包
if (!requireNamespace("survival", quietly = TRUE)) {
  install.packages("survival")
}
if (!requireNamespace("rms", quietly = TRUE)) {
  install.packages("rms")
}
if (!requireNamespace("ggplotify", quietly = TRUE)) {
  install.packages("ggplotify")
}

# 加载包
library(survival)
library(rms)
library(ggplotify)校准曲线
注记
Hiplot 网站
本页面为 Hiplot Calibration Curve 插件的源码版本教程,您也可以使用 Hiplot 网站实现无代码绘图,更多信息请查看以下链接:
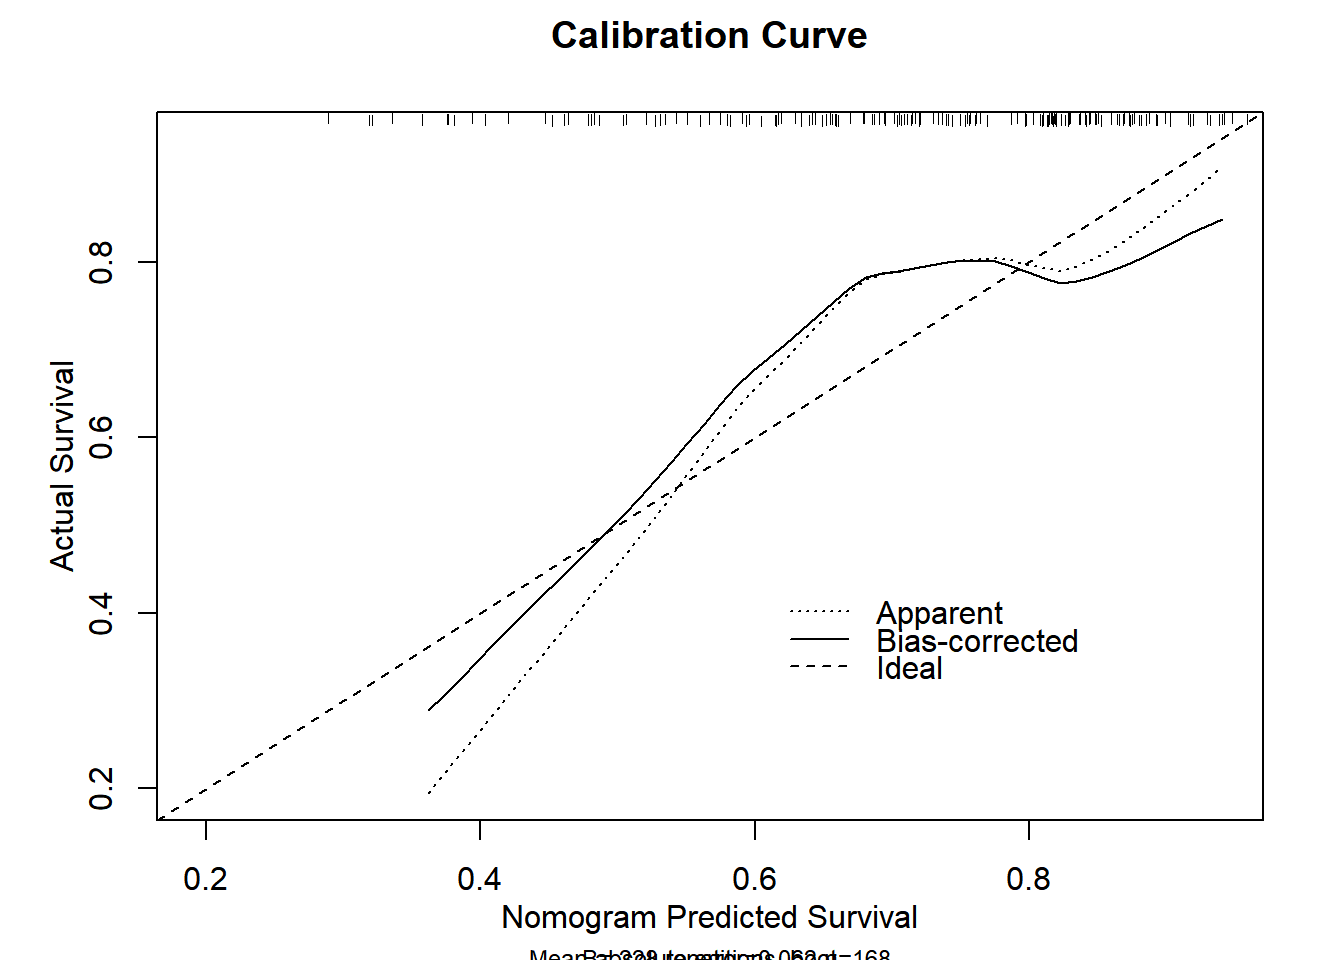
校准曲线用于评估一致性/校准,即预测值和实际值之间的差异。
环境配置
系统: Cross-platform (Linux/MacOS/Windows)
编程语言: R
依赖包:
survival;rms;ggplotify
数据准备
多列数据的数据帧(数字允许NA)。ie生存数据(状态为0和1)。
# 加载数据
data <- read.table("files/Hiplot/018-calibration-curve-data.txt", header = T)

# 整理数据格式
res.lrm <- lrm(as.formula(paste(
  "status ~ ",
  paste(colnames(data)[3:length(colnames(data))], collapse = "+"))),
  data = data, x = TRUE, y = TRUE)

lrm.cal <- calibrate(res.lrm, method = "boot", B = length(rownames(data)))

# 查看数据
head(data)
time status age sex ph.ecog ph.karno pat.karno meal.cal wt.loss
1 306 2 74 1 1 90 100 1175 NA
2 455 2 68 1 0 90 90 1225 15
3 1010 1 56 1 0 90 90 NA 15
4 210 2 57 1 1 90 60 1150 11
5 883 2 60 1 0 100 90 NA 0
6 1022 1 74 1 1 50 80 513 0可视化
# 校准曲线
p <- as.ggplot(function() {
  plot(lrm.cal,
       xlab = "Nomogram Predicted Survival",
       ylab = "Actual Survival",
       main = "Calibration Curve"
       )
})
n=168   Mean absolute error=0.067   Mean squared error=0.00524
0.9 Quantile of absolute error=0.099
p