# 安装包
if (!requireNamespace("ggplot2", quietly = TRUE)) {
  install.packages("ggplot2")
}
if (!requireNamespace("grafify", quietly = TRUE)) {
  install.packages("grafify")
}
if (!requireNamespace("ggpubr", quietly = TRUE)) {
  install.packages("ggpubr")
}

# 加载包
library(ggplot2)
library(grafify)
library(ggpubr)误差线柱状图2
注记
Hiplot 网站
本页面为 Hiplot Barplot (errorbar2) 插件的源码版本教程,您也可以使用 Hiplot 网站实现无代码绘图,更多信息请查看以下链接:
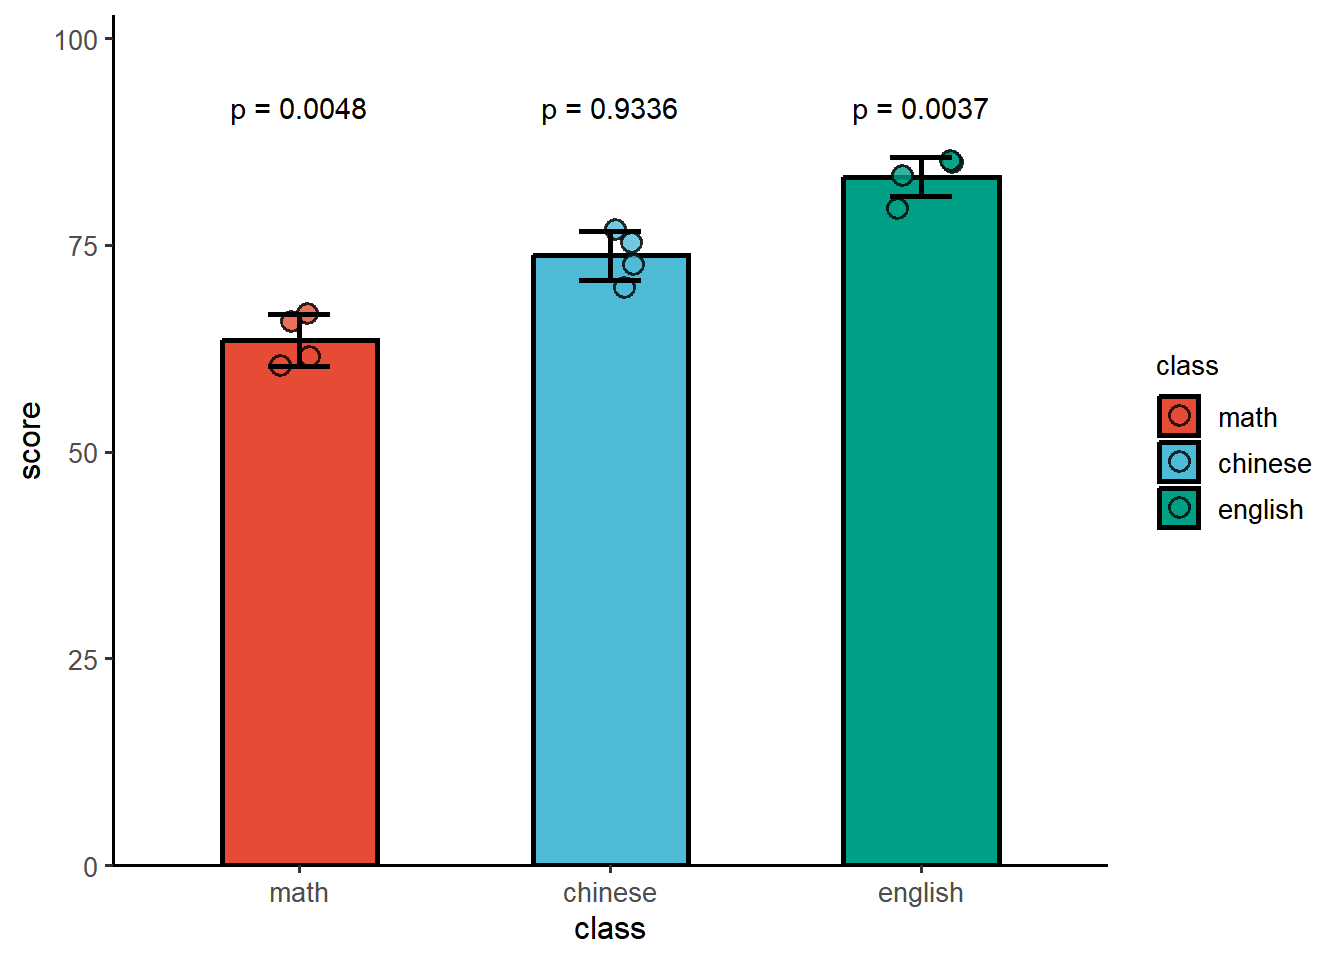
带误差线和误差组的条形图。
环境配置
系统: Cross-platform (Linux/MacOS/Windows)
编程语言: R
依赖包:
ggplot2;grafify;ggpubr
数据准备
数据表:
第一列: (数值) Y 轴值。
第二列: (数值或字符串) X 轴类别。
# 加载数据
data <- read.table("files/Hiplot/006-barplot-errorbar2-data.txt", header = T)

# 整理数据格式
data[, 2] <- factor(data[, 2], levels = unique(data[, 2]))

# 查看数据
head(data)
score class
1 60 math
2 62 math
3 70 chinese
4 73 chinese
5 80 english
6 85 english可视化
# 误差线柱状图2
p <- plot_scatterbar_sd(
  data, ycol = get(colnames(data)[1]), xcol = get(colnames(data)[2]),
  b_alpha = 1, ewid = 0.2, jitter = 0.1) +
  stat_compare_means(data = data, aes(data[, 2], data[, 1], fill = data[, 2]),
                     label = "p.format", ref.group = ".all.", vjust = -2,
                     method = "t.test") +
  guides(fill=guide_legend(title=colnames(data)[2])) +
  scale_y_continuous(expand = expansion(mult = c(0, 0.2))) +
  labs(x="class", y="score") +
  scale_fill_manual(values = c("#E64B35FF","#4DBBD5FF","#00A087FF","#3C5488FF")) +
  theme_classic2() +
  theme(text = element_text(family = "Arial"),
        plot.title = element_text(size = 12,hjust = 0.5),
        axis.title = element_text(size = 12),
        axis.text = element_text(size = 10),
        axis.text.x = element_text(angle = 0, hjust = 0.5, vjust = 1),
        legend.position = "right",
        legend.direction = "vertical",
        legend.title = element_text(size = 10),
        legend.text = element_text(size = 10))

p