# 安装包
if (!requireNamespace("ggplot2", quietly = TRUE)) {
  install.packages("ggplot2")
}
if (!requireNamespace("reshape2", quietly = TRUE)) {
  install.packages("reshape2")
}
if (!requireNamespace("ggisoband", quietly = TRUE)) {
  install.packages("ggisoband")
}
if (!requireNamespace("cowplot", quietly = TRUE)) {
  install.packages("cowplot")
}

# 加载包
library(ggplot2)
library(reshape2)
library(ggisoband)
library(cowplot)等高线图 (矩阵)
注记
Hiplot 网站
本页面为 Hiplot Contour (Matrix) 插件的源码版本教程,您也可以使用 Hiplot 网站实现无代码绘图,更多信息请查看以下链接:
等高图(矩阵)是一种以二维形式展示三维数据的图形。
环境配置
系统: Cross-platform (Linux/MacOS/Windows)
编程语言: R
依赖包:
ggplot2;reshape2;ggisoband;cowplot
数据准备
载入数据为一个矩阵。
# 加载数据
data <- read.delim("files/Hiplot/027-contour-matrix-data.txt", header = T)

# 整理数据格式
data <- as.matrix(data)
colnames(data) <- NULL
data3d <- reshape2::melt(data)
names(data3d) <- c("x", "y", "z")

# 查看数据
head(data3d)
x y z
1 1 1 101
2 2 1 102
3 3 1 103
4 4 1 104
5 5 1 105
6 6 1 105可视化
# 等高线图 (矩阵)
complex_general_theme <-
  theme(text = element_text(family = "Arial"),
        plot.title = element_text(size = 12,hjust = 0.5),
        axis.title = element_text(size = 12),
        axis.text = element_text(size = 10),
        axis.text.x = element_text(angle = 0, hjust = 0.5,vjust = 1),
        legend.position = "right",
        legend.direction = "vertical",
        legend.title = element_text(size = 10),
        legend.text = element_text(size = 10))

p1 <- ggplot(data3d, aes(x, y, z = z)) +
  geom_isobands(
    alpha = 1,
    aes(color = stat(zmin)), fill = NA
  ) +
  scale_color_viridis_c() +
  coord_cartesian(expand = FALSE) +
  theme_bw() +
  complex_general_theme

p2 <- ggplot(data3d, aes(x, y, z = z)) +
  geom_isobands(
    alpha = 1,
    aes(fill = stat(zmin)), color = NA
  ) +
  scale_fill_viridis_c(guide = "legend") +
  coord_cartesian(expand = FALSE) +
  theme_bw() +
  complex_general_theme

plot_grid(p1, p2, labels = c("A", "B"), label_size = 12)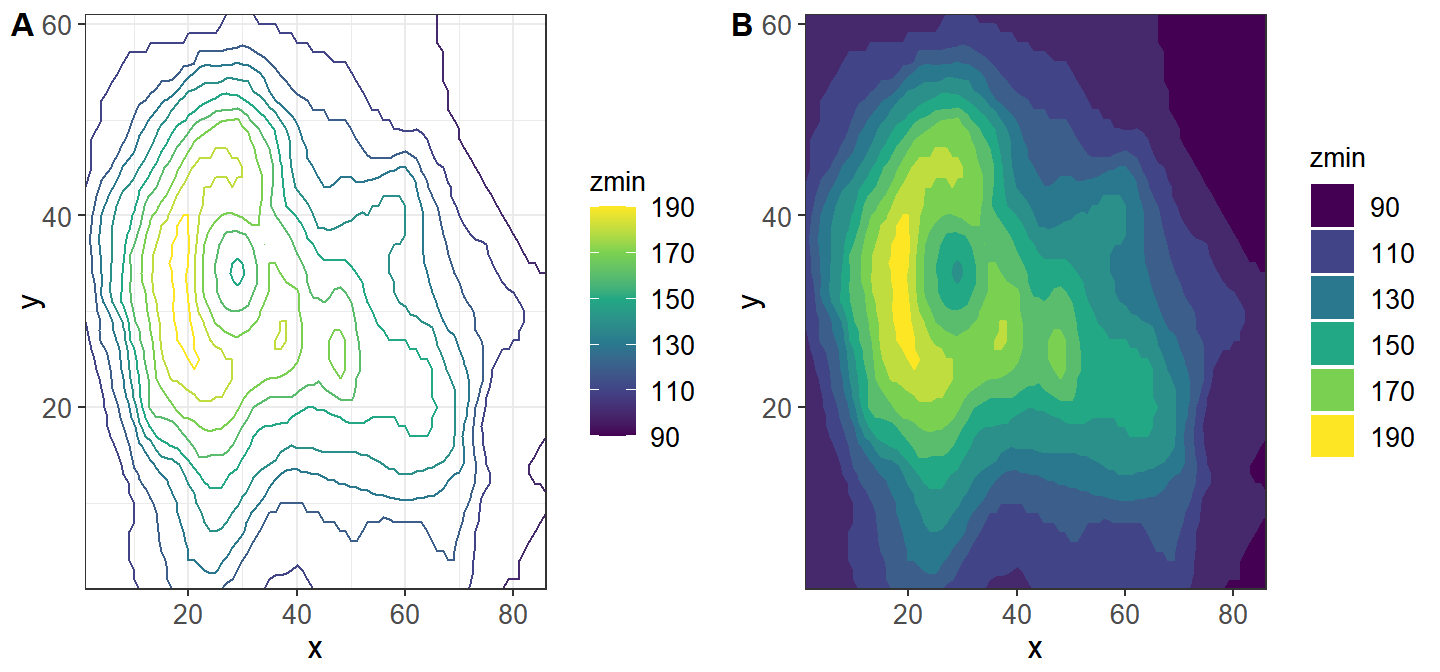
黄色代表最高,深紫色代表最低,高度刻度范围是90-190。