# 安装包
if (!requireNamespace("ggplot2", quietly = TRUE)) {
  install.packages("ggplot2")
}

# 加载包
library(ggplot2)分组折线图
注记
Hiplot 网站
本页面为 Hiplot Group Line 插件的源码版本教程,您也可以使用 Hiplot 网站实现无代码绘图,更多信息请查看以下链接:
环境配置
系统: Cross-platform (Linux/MacOS/Windows)
编程语言: R
依赖包:
ggplot2
数据准备
# 加载数据
data <- read.delim("files/Hiplot/084-group-line-data.txt", header = T)

# 查看数据
head(data)
x y names groups
1 1 2.253573 L1 A
2 2 2.231082 L1 A
3 3 1.740380 L1 A
4 4 2.255786 L1 A
5 5 2.429561 L1 A
6 6 1.951557 L1 A可视化
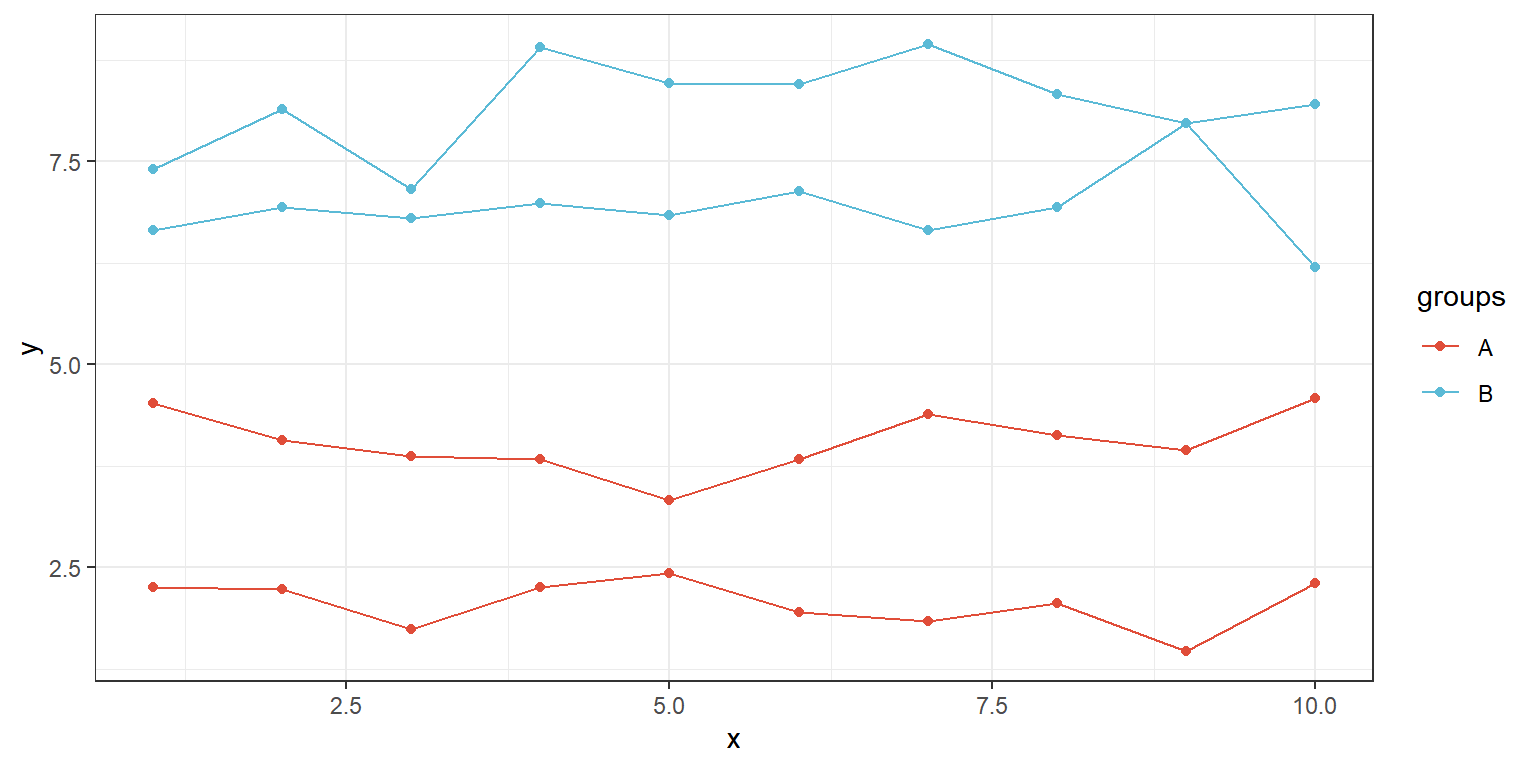
# 分组折线图
p <- ggplot(data, aes(x = x, y = y, group = names, color = groups)) +
  geom_line() +
  geom_point() +
  scale_color_manual(values = c("#e04d39","#5bbad6")) +
  theme_bw()

p