# 安装包
if (!requireNamespace("fishplot", quietly = TRUE)) {
  install_github("chrisamiller/fishplot")
}

# 加载包
library(fishplot)鱼形图
注记
Hiplot 网站
本页面为 Hiplot Fishplot 插件的源码版本教程,您也可以使用 Hiplot 网站实现无代码绘图,更多信息请查看以下链接:
克隆演化分析。
环境配置
系统: Cross-platform (Linux/MacOS/Windows)
编程语言: R
依赖包:
fishplot
数据准备
# 加载数据
data <- read.delim("files/Hiplot/055-fishplot-data.txt", header = T)
# 查看数据
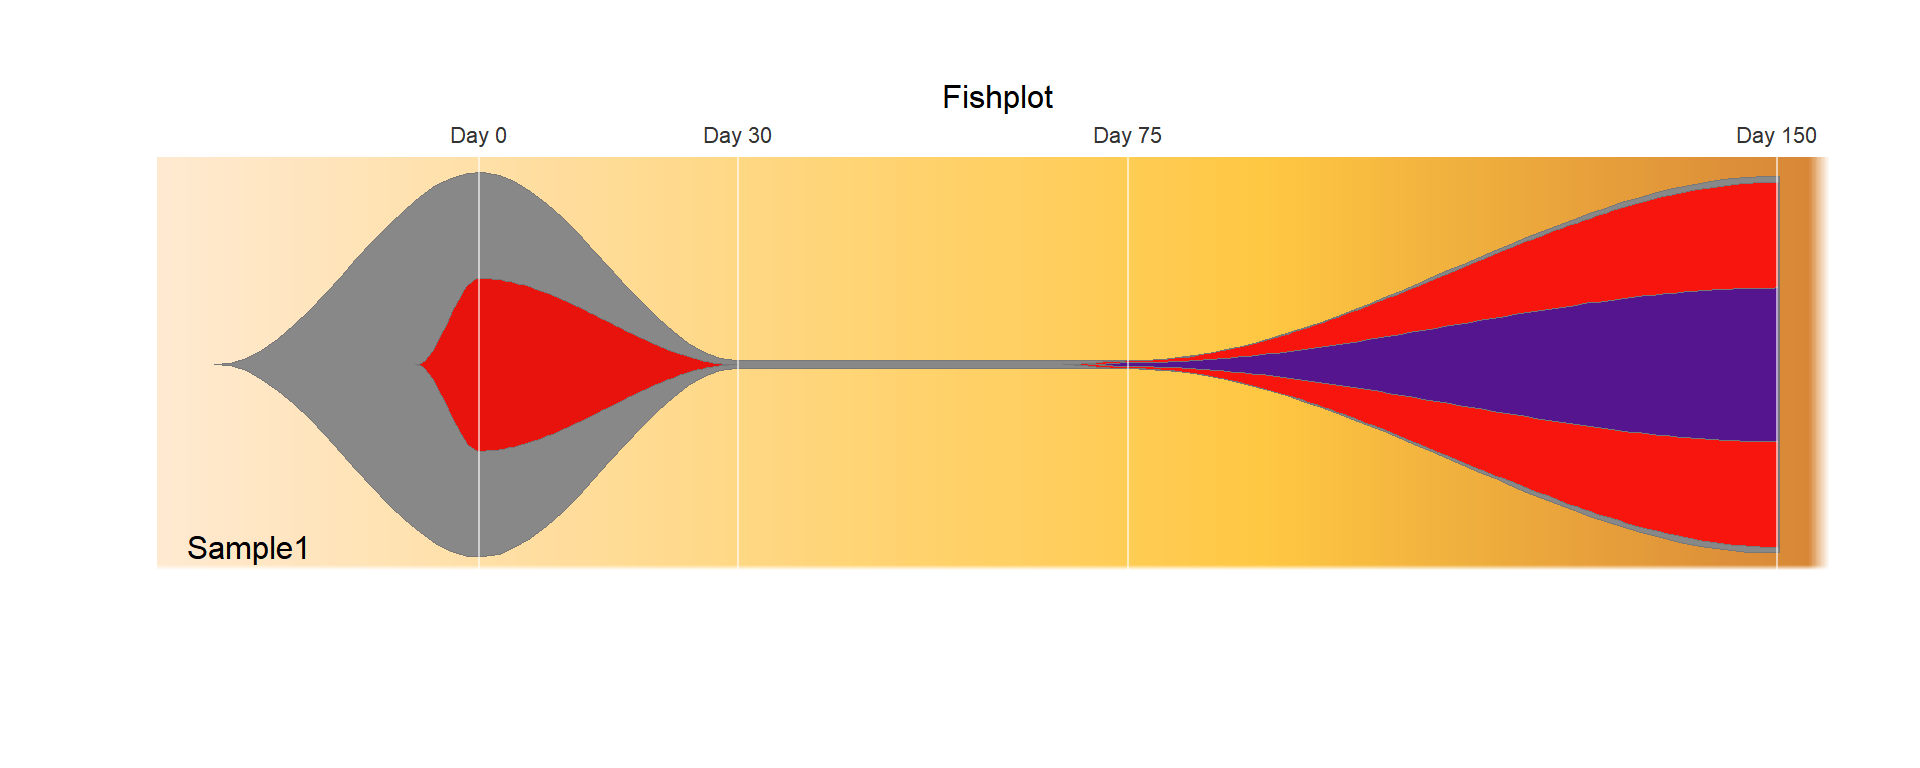
head(data) timepoints parents sample.name event1 event2 event3 event4
1 0 0 Sample1 100 2 2 98
2 30 1 Sample1 45 0 0 0
3 75 1 Sample1 0 0 2 95
4 150 3 Sample1 0 0 1 40timepoints:为矩阵的每一列指定时间点
parents:指定克隆之间的父母关系
samplename:样品名称(支持多个样品)
other:包含所有时间点所有克隆的肿瘤比例估计值的数值矩阵
可视化
## 创建一个 fish 对象
fish = createFishObject(as.matrix(data[,4:7]), parents=data$parents,
                        timepoints=data$timepoints,
                        col = c("#888888","#e8130c","#f8150d","#55158f"))
## 计算绘图的布局
fish = layoutClones(fish)
## 使用 splining 方法绘制图(推荐),并提供标签和绘图标题的时间点
fishPlot(fish,shape="spline", title.btm="Sample1", title = "Fishplot",
         cex.title=1, vlines=c(0,30,75,150),
         vlab=c("Day 0","Day 30","Day 75","Day 150"))