# 安装包
if (!requireNamespace("ape", quietly = TRUE)) {
  install.packages("ape")
}
if (!requireNamespace("ggplotify", quietly = TRUE)) {
  install.packages("ggplotify")
}

# 加载包
library(ape)
library(ggplotify)系统树图
注记
Hiplot 网站
本页面为 Hiplot Dendrogram 插件的源码版本教程,您也可以使用 Hiplot 网站实现无代码绘图,更多信息请查看以下链接:
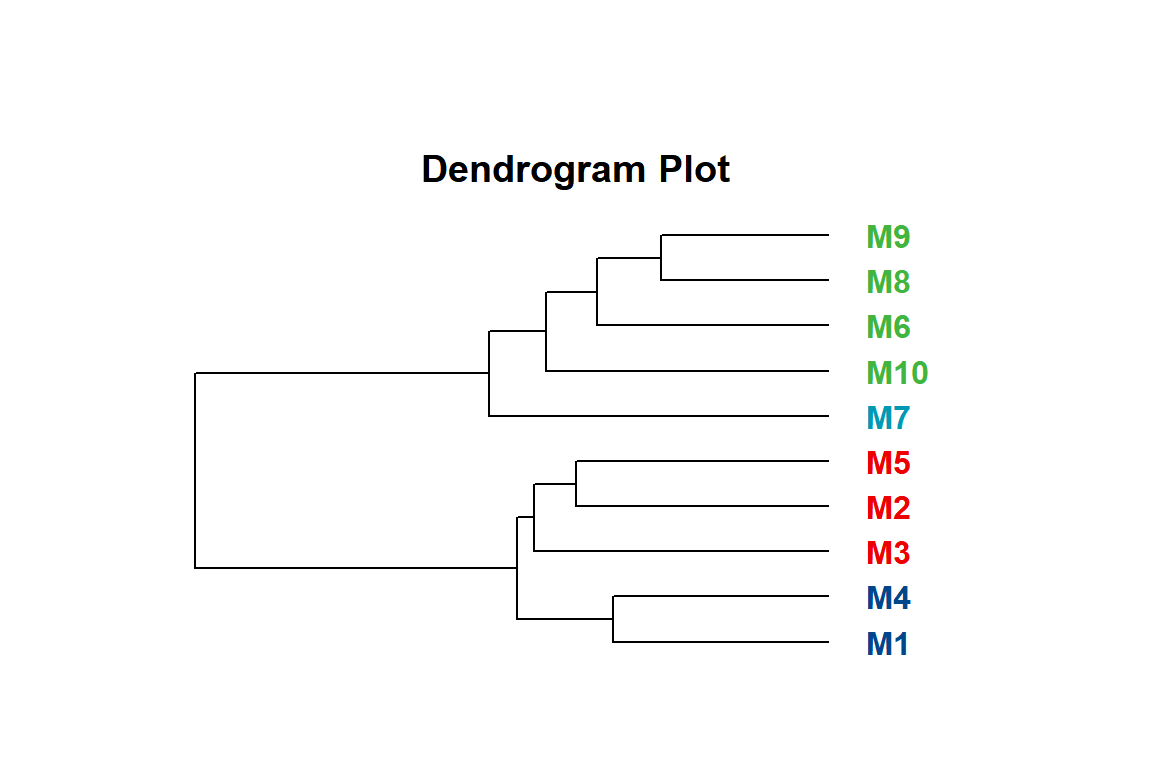
系统树图是一种以树的形状表示的图。这种图表在不同情景有不同的含义。如:在层次聚类中,说明了相应分析产生的聚类的排列。在生物信息中,它显示基因或样本的聚集,有时在热图的边缘。
环境配置
系统: Cross-platform (Linux/MacOS/Windows)
编程语言: R
依赖包:
ape;ggplotify
数据准备
# 加载数据
data <- read.delim("files/Hiplot/037-dendrogram-data.txt", header = T)

# 整理数据格式
data <- data[, -1]

# 查看数据
head(data)
M1 M2 M3 M4 M5 M6 M7 M8
1 6.599344 5.226266 3.693288 3.938501 4.527193 9.308119 8.987865 7.658312
2 5.760380 4.892783 5.448924 3.485413 3.855669 8.662081 8.793320 8.765915
3 9.561905 4.549168 3.998655 5.614384 3.904793 9.790770 7.133188 7.379591
4 8.396409 8.717055 8.039064 7.643060 9.274649 4.417013 4.725270 3.542217
5 8.419766 8.268430 8.451181 9.200732 8.598207 4.590033 5.368268 4.136667
6 7.653074 5.780393 10.633550 5.913684 8.805605 5.890120 5.527945 3.822596
M9 M10
1 8.666038 7.419708
2 8.097206 8.262942
3 7.938063 6.154118
4 4.305187 6.964710
5 4.910986 4.080363
6 4.041078 7.956589可视化
# 系统树图
d <- dist(t(data), method = "euclidean")
hc <- hclust(d, method = "complete")
clus <- cutree(hc, 4)

p <- as.ggplot(function() {
  par(mar = c(5, 5, 10, 5), mgp = c(2.5, 1, 0))
  plot(as.phylo(hc),
       type = "phylogram",
       tip.color = c("#00468bff","#ed0000ff","#42b540ff","#0099b4ff")[clus],
       label.offset = 1,
       cex = 1, font = 2, use.edge.length = T
       )
  title("Dendrogram Plot", line = 1)
  })

p