# 安装包
if (!requireNamespace("ggcorrplot", quietly = TRUE)) {
  install.packages("ggcorrplot")
}

# 加载包
library(ggcorrplot)相关性热图
注记
Hiplot 网站
本页面为 Hiplot Area 插件的源码版本教程,您也可以使用 Hiplot 网站实现无代码绘图,更多信息请查看以下链接:
相关性热图是一种分析多个变量,两两之间相关性的图形。
环境配置
系统: Cross-platform (Linux/MacOS/Windows)
编程语言: R
依赖包:
ggcorrplot
数据准备
载入数据为基因名称及每个样本的表达量。
# 加载数据
data <- read.delim("files/Hiplot/030-cor-heatmap-data.txt", header = T)

# 整理数据格式
data <- data[!is.na(data[, 1]), ]
idx <- duplicated(data[, 1])
data[idx, 1] <- paste0(data[idx, 1], "--dup-", cumsum(idx)[idx])
rownames(data) <- data[, 1]
data <- data[, -1]
str2num_df <- function(x) {
  final <- NULL
  for (i in seq_len(ncol(x))) {
    final <- cbind(final, as.numeric(x[, i]))
  }
  colnames(final) <- colnames(x)
  return(final)
}
tmp <- str2num_df(t(data))
corr <- round(cor(tmp, use = "na.or.complete", method = "pearson"), 3)
p_mat <- round(cor_pmat(tmp, method = "pearson"), 3)

# 查看数据
head(data)
M1 M2 M3 M4 M5 M6 M7 M8
RGL4 8.454808 8.019389 8.990836 9.718631 7.908075 4.147051 4.985084 4.576711
MPP7 8.690520 8.630346 7.080873 9.838476 8.271824 5.179200 5.200868 3.266993
UGCG 8.648366 8.600555 9.431046 7.923021 8.309214 4.902510 5.750804 4.492856
CYSTM1 8.628884 9.238677 8.487243 8.958537 7.357109 4.541605 6.370533 4.246651
ANXA2 4.983769 6.748022 6.220791 4.719403 3.284346 8.089850 10.637472 7.214912
ENDOD1 5.551640 5.406465 4.663785 3.550765 4.103507 8.393991 9.538503 9.069923
M9 M10
RGL4 4.930349 4.293700
MPP7 5.565226 4.300309
UGCG 4.659987 3.306275
CYSTM1 4.745769 3.449627
ANXA2 9.002710 5.123359
ENDOD1 8.639664 7.106392可视化
# 相关性热图
p <- ggcorrplot(
  corr,
  colors = c("#4477AA", "#FFFFFF", "#BB4444"),
  method = "circle",
  hc.order = T,
  hc.method = "ward.D2",
  outline.col = "white",
  ggtheme = theme_bw(),
  type = "upper",
  lab = F,
  lab_size = 3,
  legend.title = "Correlation"
  ) +
  ggtitle("Cor Heatmap Plot") +
  theme(text = element_text(family = "Arial"),
        plot.title = element_text(size = 12,hjust = 0.5),
        axis.title = element_text(size = 12),
        axis.text = element_text(size = 10),
        axis.text.x = element_text(angle = 45, hjust = 1, vjust = 1),
        legend.position = "right",
        legend.direction = "vertical",
        legend.title = element_text(size = 10),
        legend.text = element_text(size = 10))
p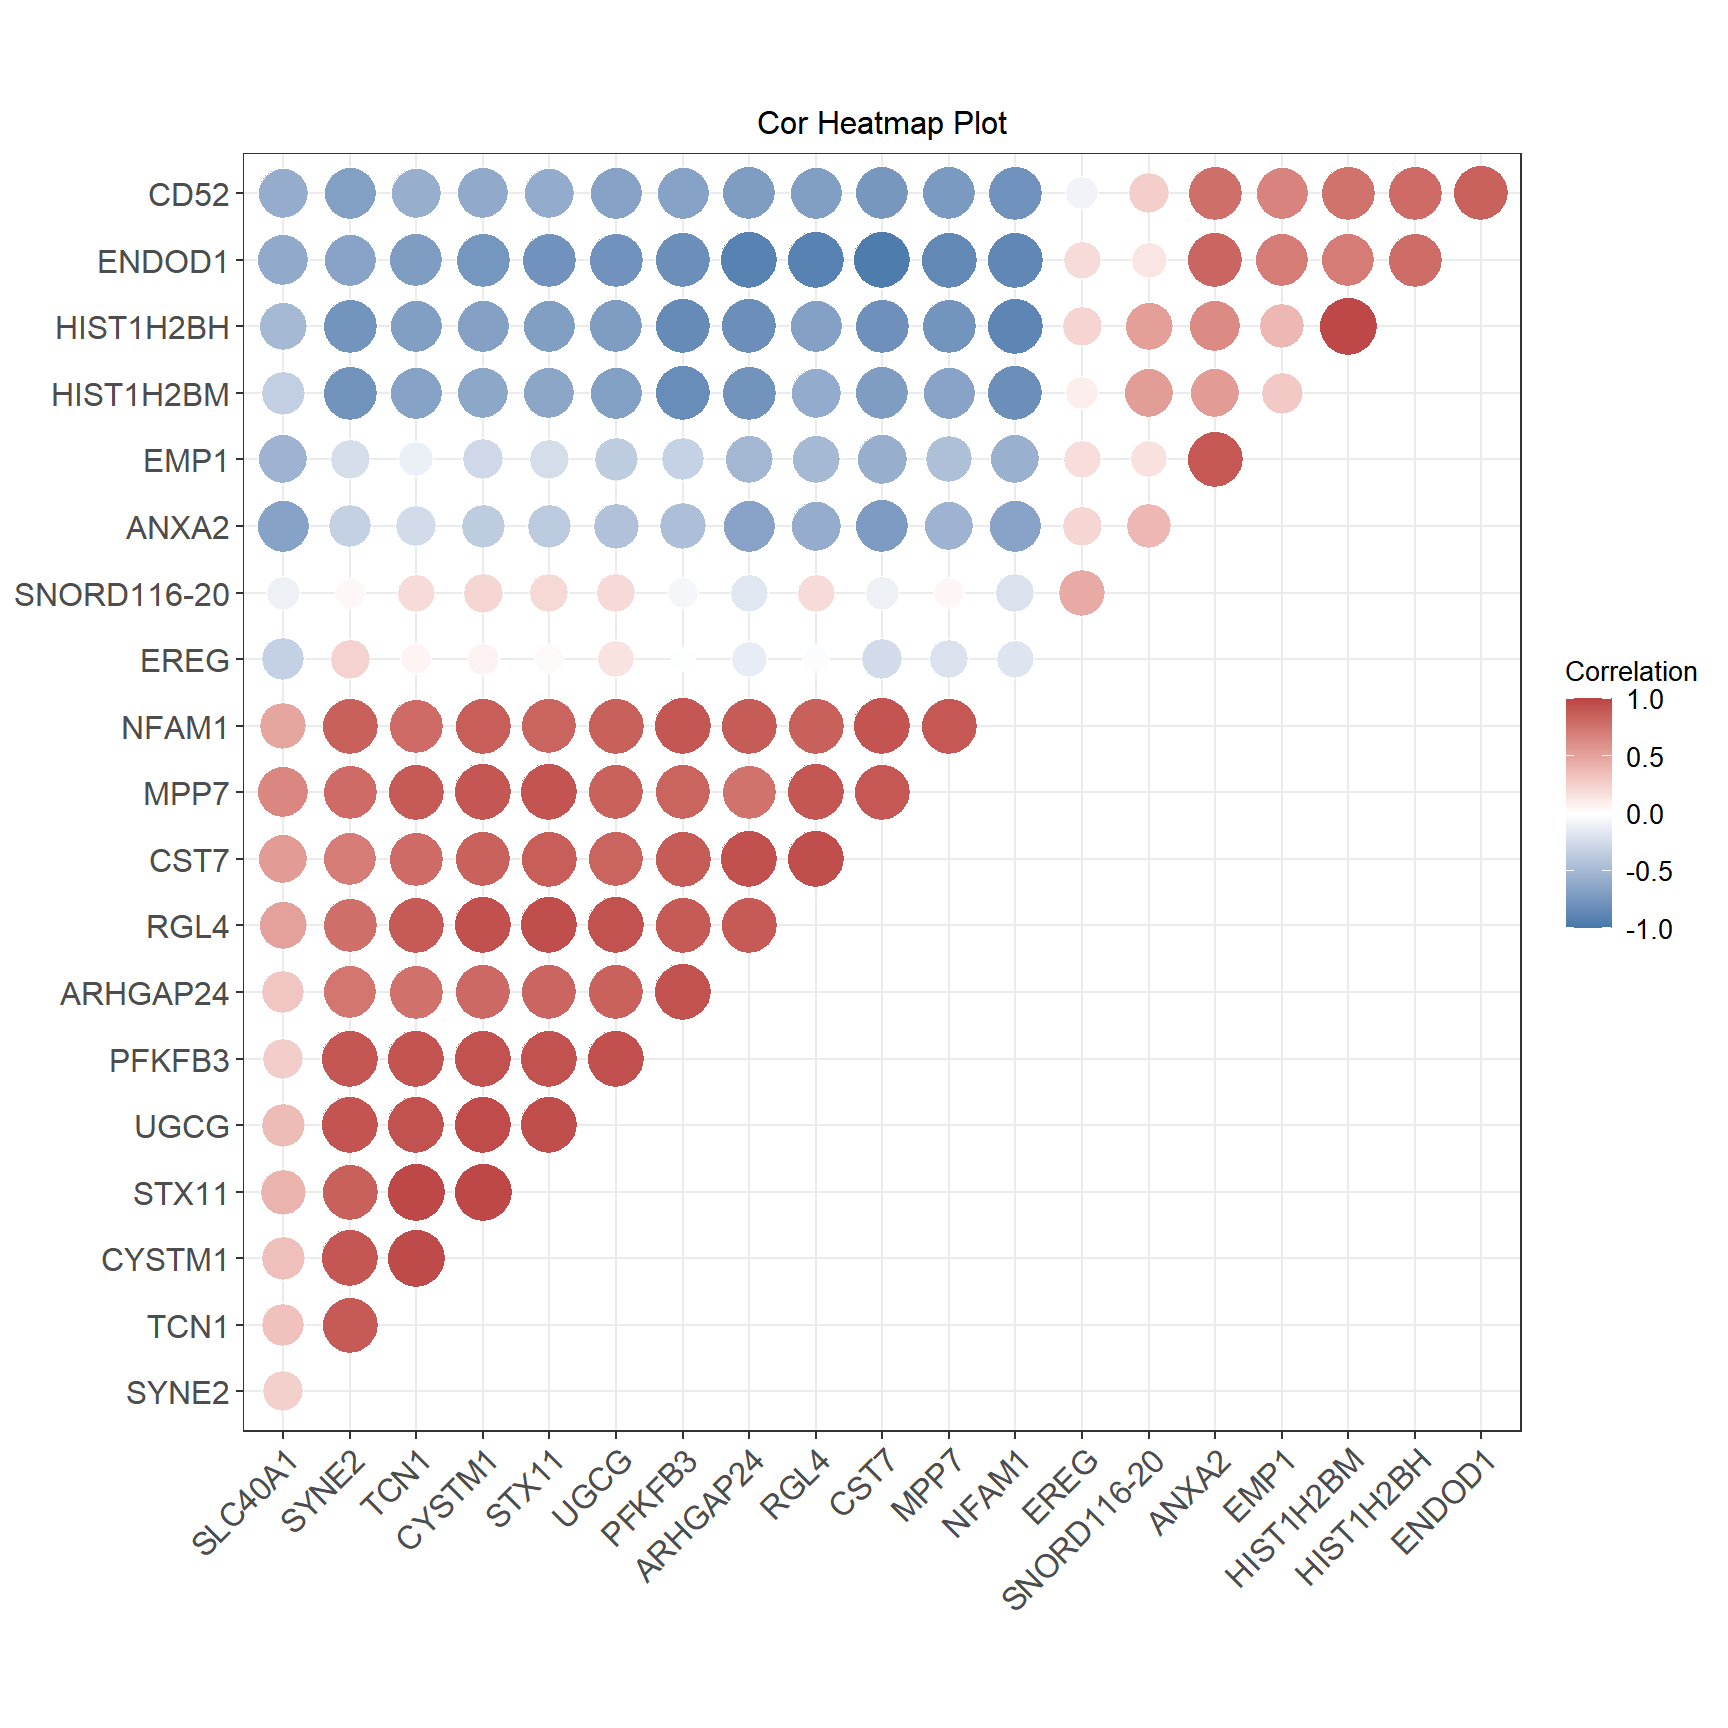
红色系表示两个基因之间呈正相关,蓝色系表示两个基因之间呈负相关,每一格中的数字表示相关系数。