# 安装包
if (!requireNamespace("ggpubr", quietly = TRUE)) {
  install.packages("ggpubr")
}
if (!requireNamespace("ggthemes", quietly = TRUE)) {
  install.packages("ggthemes")
}

# 加载包
library(ggpubr)
library(ggthemes)箱式图
注记
Hiplot 网站
本页面为 Hiplot Boxplot 插件的源码版本教程,您也可以使用 Hiplot 网站实现无代码绘图,更多信息请查看以下链接:
箱形图是一种通过四分位数图形象化地描述一组数据分布特征的方法。
环境配置
系统: Cross-platform (Linux/MacOS/Windows)
编程语言: R
依赖包:
ggpubr;ggthemes
数据准备
载入数据为数据集 (不同治疗方案的治疗效果数据)。
# 加载数据
data <- read.table("files/Hiplot/015-boxplot-data.txt", header = T)

# 整理数据格式
groups <- unique(data[, 2])
my_comparisons <- combn(groups, 2, simplify = FALSE)
my_comparisons <- lapply(my_comparisons, as.character)

# 查看数据
head(data)
Value Group1 Group2
1 4.2 low treat1
2 11.5 low treat1
3 7.3 low treat1
4 5.8 low treat1
5 6.4 low treat1
6 10.0 low treat1可视化
# 箱式图
p <- ggboxplot(data, x = "Group1", y = "Value", notch = F, facet.by = "Group2",
               add = "point", color = "Group1", xlab = "Group2", ylab = "Value",
               palette = c("#e04d39","#5bbad6","#1e9f86"),
               title = "Box Plot") +
  stat_compare_means(comparisons = my_comparisons, label = "p.format",
                     method = "t.test") +
  scale_y_continuous(expand = expansion(mult = c(0.1, 0.1))) +
  theme_stata() +
  theme(text = element_text(family = "Arial"),
        plot.title = element_text(size = 12,hjust = 0.5),
        axis.title = element_text(size = 12),
        axis.text = element_text(size = 10),
        axis.text.x = element_text(angle = 0, hjust = 0.5,vjust = 1),
        legend.position = "right",
        legend.direction = "vertical",
        legend.title = element_text(size = 10),
        legend.text = element_text(size = 10))

p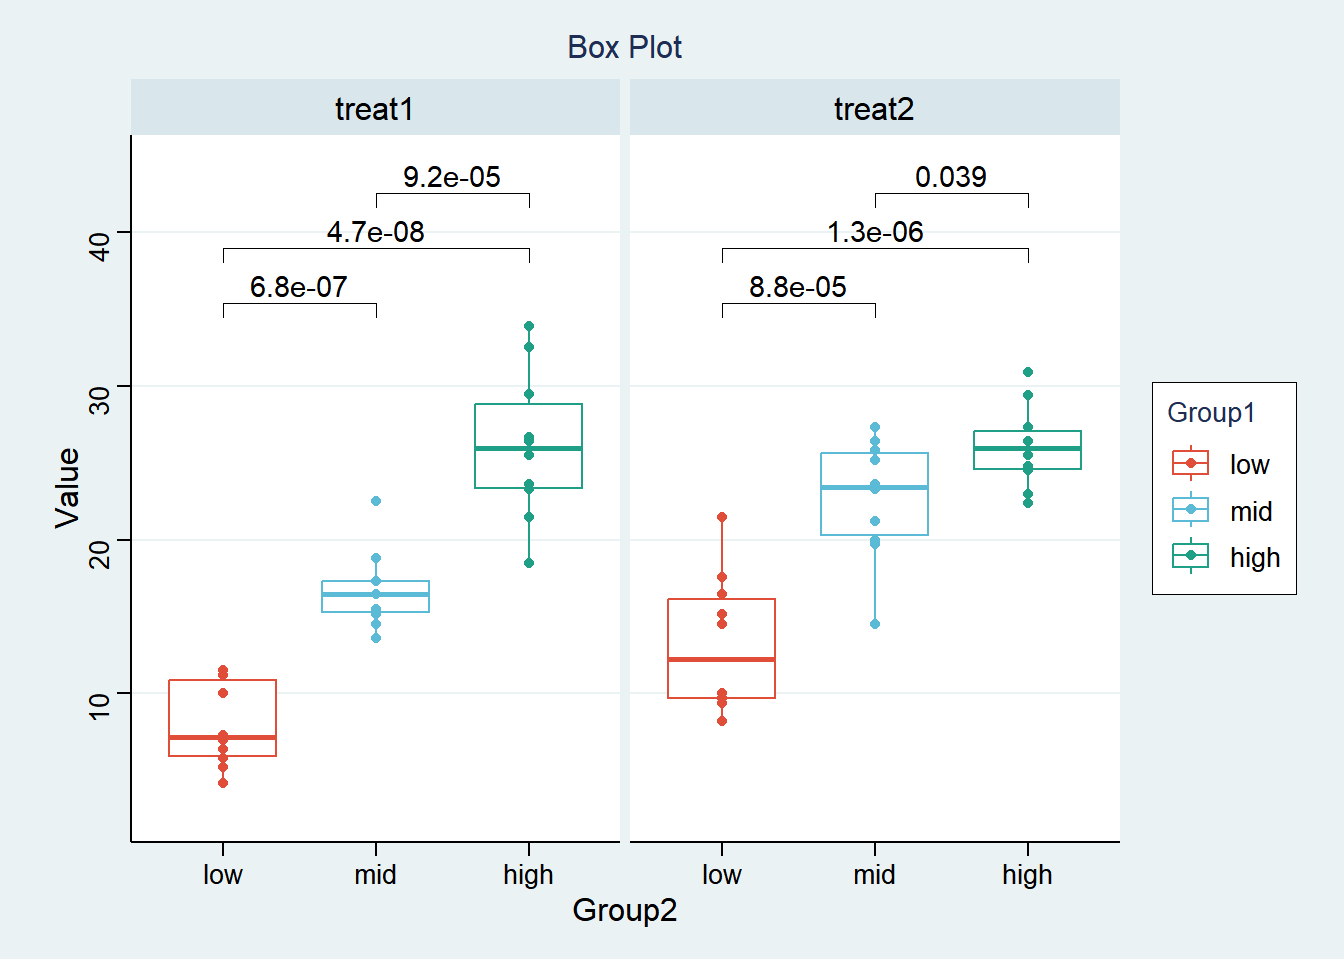
横坐标表示几组不同的数据,纵坐标分别表示各组数据的四分位数;即方框上、中、下的横线分别代表上四分位数,中位数,下四分位数;上下方线段代表的数值分别指数据最大值和最小值,方框以外的点代表离群值。图示上方数值表示两两变量间的 P 值,可认为治疗方案 1 中,中剂量组同低剂量组疗效有显著差异,以此类推。