# 安装包
if (!requireNamespace("RIdeogram", quietly = TRUE)) {
  install.packages("RIdeogram")
}

# 加载包
library(RIdeogram)共线性图
共线性图(Collinearity Plot)常用于比较不同物种的基因组序列,识别保守的同源基因区块及其排列顺序,揭示进化过程中染色体结构的变化。该图广泛应用于研究基因组进化、功能基因定位及物种亲缘关系分析等。
示例
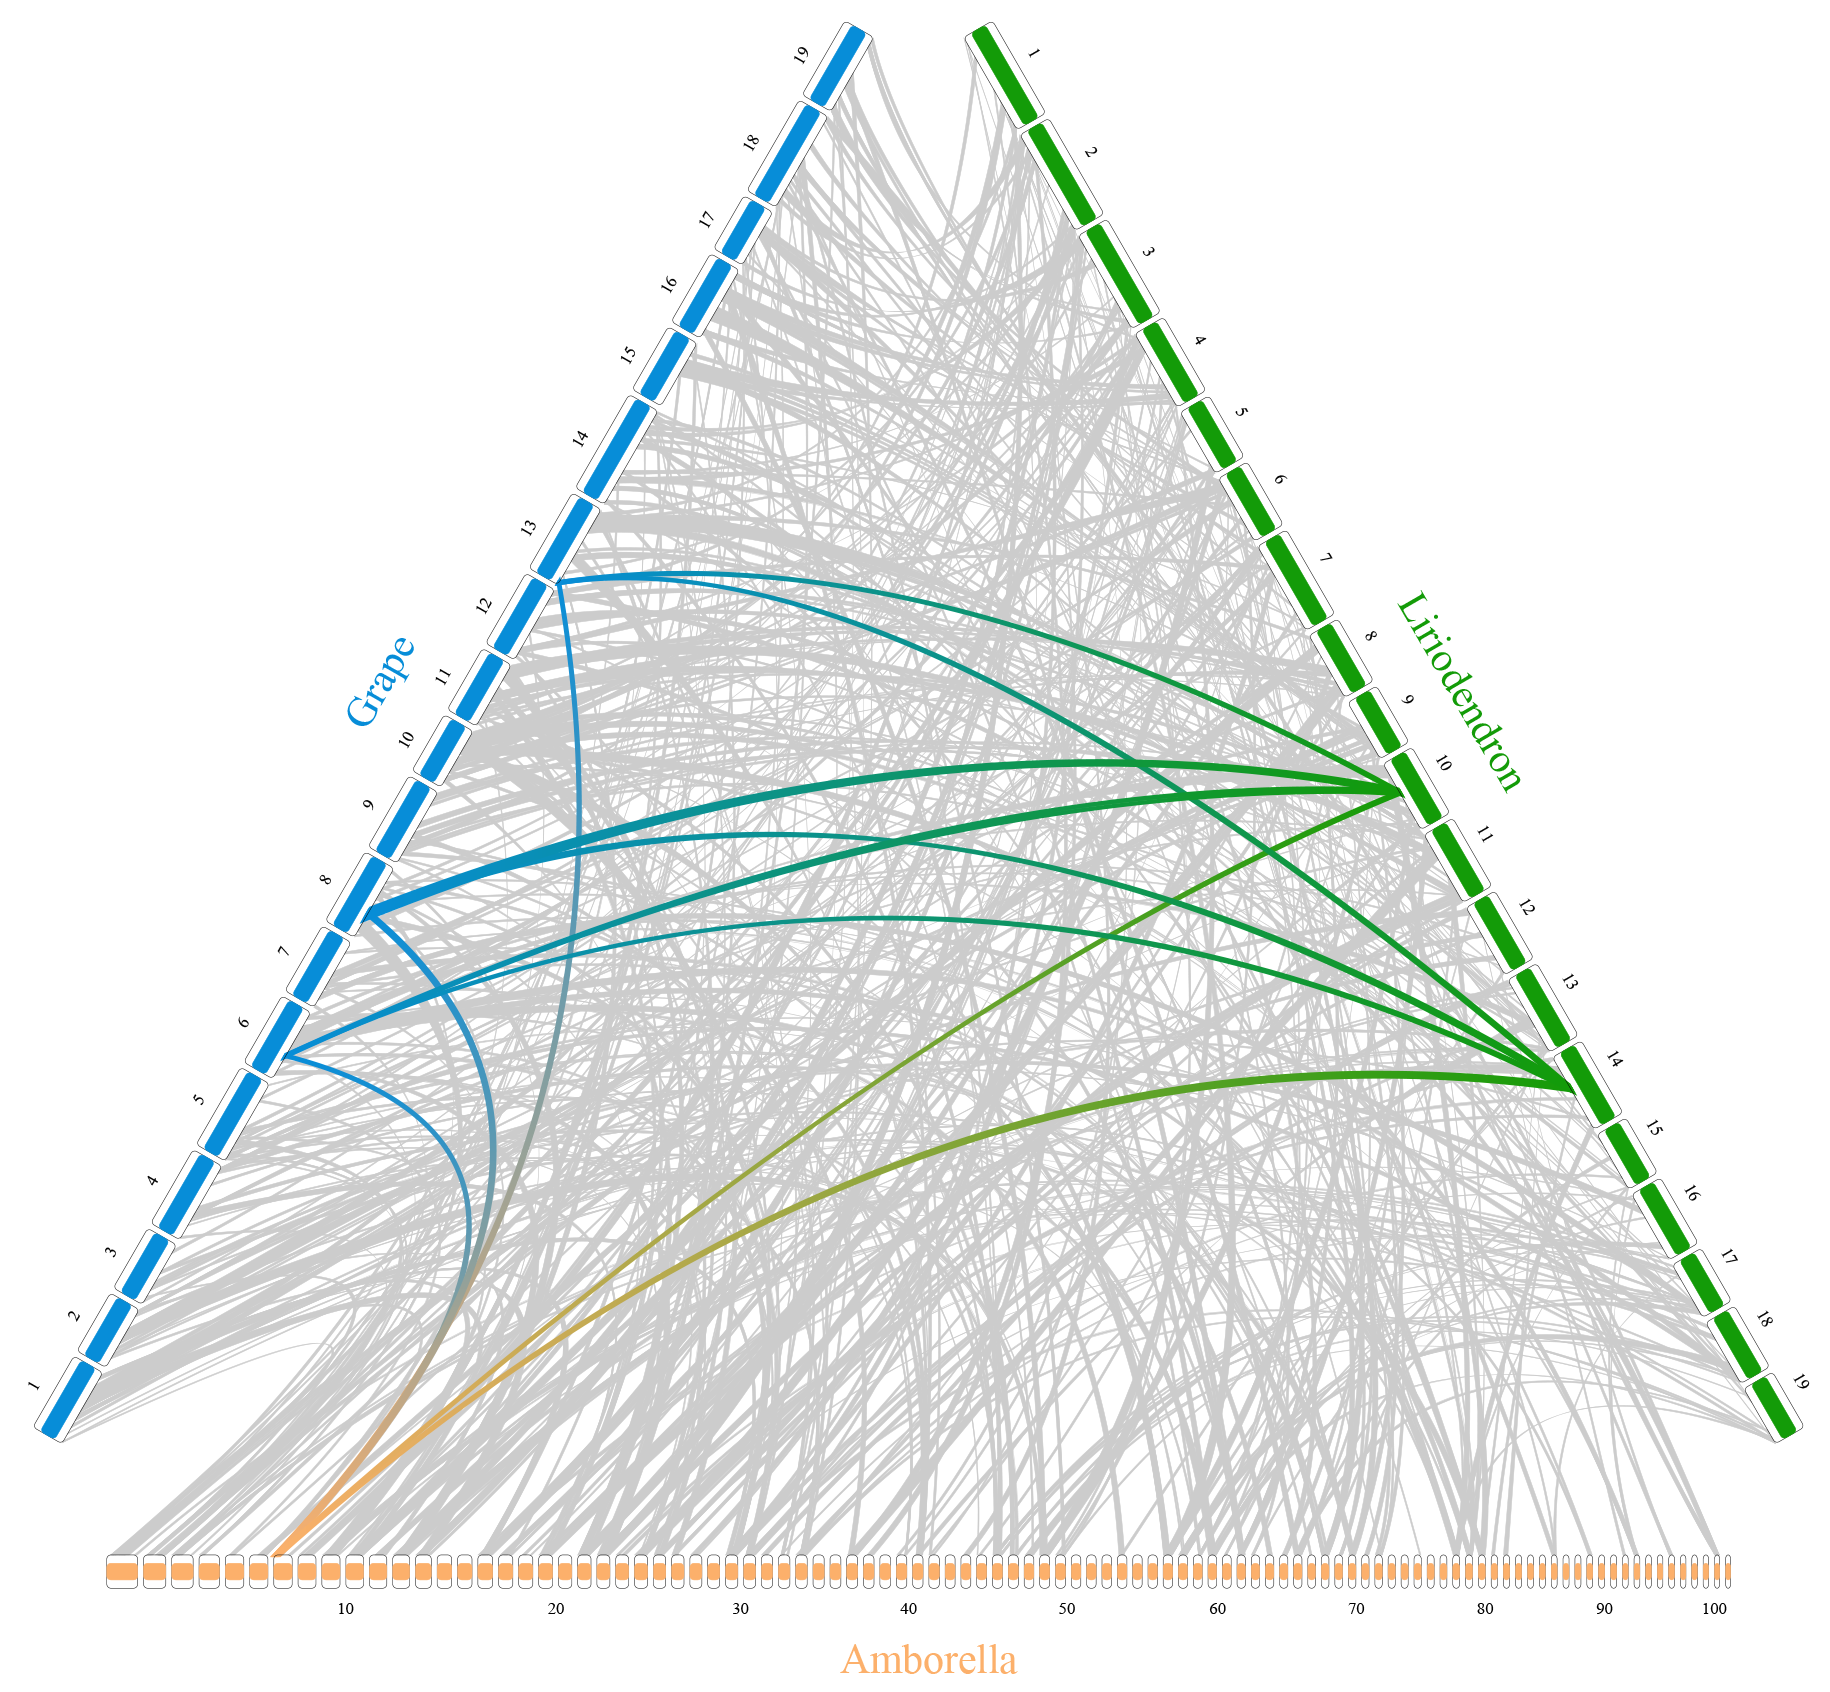
该图为三元基因组的共线性图,其中 Amborella、Grape、Liriodendron 表示三个不同的物种,长条代表基因组,数字为染色体编号,连线表示不同的物种基因组之间的比较。高亮的连线表示感兴趣的基因组区域的比较。
环境配置
系统: 跨平台(Linux/MacOS/Windows)
编程语言: R
依赖包:
RIdeogram
数据准备
我们导入 RIdeogram 包中提供的示例数据,karyotype_ternary_comparison 中包含了不同的物种以及基因组信息,synteny_ternary_comparison 中包含了不同物种之间基因组的比较信息。
data(karyotype_ternary_comparison, package="RIdeogram")
data(synteny_ternary_comparison, package="RIdeogram")
# 查看 karyotype_ternary_comparison 数据格式
head(karyotype_ternary_comparison) Chr Start End fill species size color
1 NA 1 15980527 fcb06b Amborella 10 fcb06b
2 NA 1 11522362 fcb06b Amborella 10 fcb06b
3 NA 1 11085951 fcb06b Amborella 10 fcb06b
4 NA 1 10537363 fcb06b Amborella 10 fcb06b
5 NA 1 9585472 fcb06b Amborella 10 fcb06b
6 NA 1 9414115 fcb06b Amborella 10 fcb06b# 查看 synteny_ternary_comparison 数据格式
head(synteny_ternary_comparison) Species_1 Start_2 End_2 Species_2 Start_1 End_1 fill type
1 1 4761181 2609697 1 342802 981451 cccccc 1
2 6 6344197 8074393 1 15387184 16716190 cccccc 1
3 10 6457890 9052487 1 11224953 14959548 cccccc 1
4 13 6318795 1295413 1 20564870 21386271 cccccc 1
5 16 1398101 2884119 1 21108654 22221088 cccccc 1
6 16 1482529 2093625 1 21864494 22364888 cccccc 1可视化
1. 基础绘图
可以使用 RIdeogram 包中提供的 ideogram 函数绘制共线性图。
# 基础共线性图
ideogram(karyotype = karyotype_ternary_comparison, synteny = synteny_ternary_comparison)
convertSVG("chromosome.svg", device = "png")
提示
关键参数:
-
karyotype:包含不同物种以及基因组信息的表格,数据结构如
karyotype_ternary_comparison所示。 -
overlaid:包含了不同物种之间基因组比较信息的表格,数据结构如
synteny_ternary_comparison所示。
2. 修改颜色
如果您想对修改绘图的颜色,只需修改 karyotype 和 overlaid 表格中的颜色列。如下所示,我们修改了 karyotype_ternary_comparison 表格中的 color 和 fill 列,以及 synteny_ternary_comparison 中的 fill 列。
# 修改三个物种颜色
change_color1 <- c("fcb06b"="ff0000", "078dd8"="00ff00", "139b08"="0000ff")
karyotype_ternary_comparison$color <- as.character(change_color1[karyotype_ternary_comparison$color])
karyotype_ternary_comparison$fill <- as.character(change_color1[karyotype_ternary_comparison$fill])

# 修改连线颜色
change_color2 <- c("cccccc"="add8e6", "e41a1c"="8b0000")
synteny_ternary_comparison$fill <- as.character(change_color2[synteny_ternary_comparison$fill])

# 绘图
ideogram(karyotype = karyotype_ternary_comparison, synteny = synteny_ternary_comparison)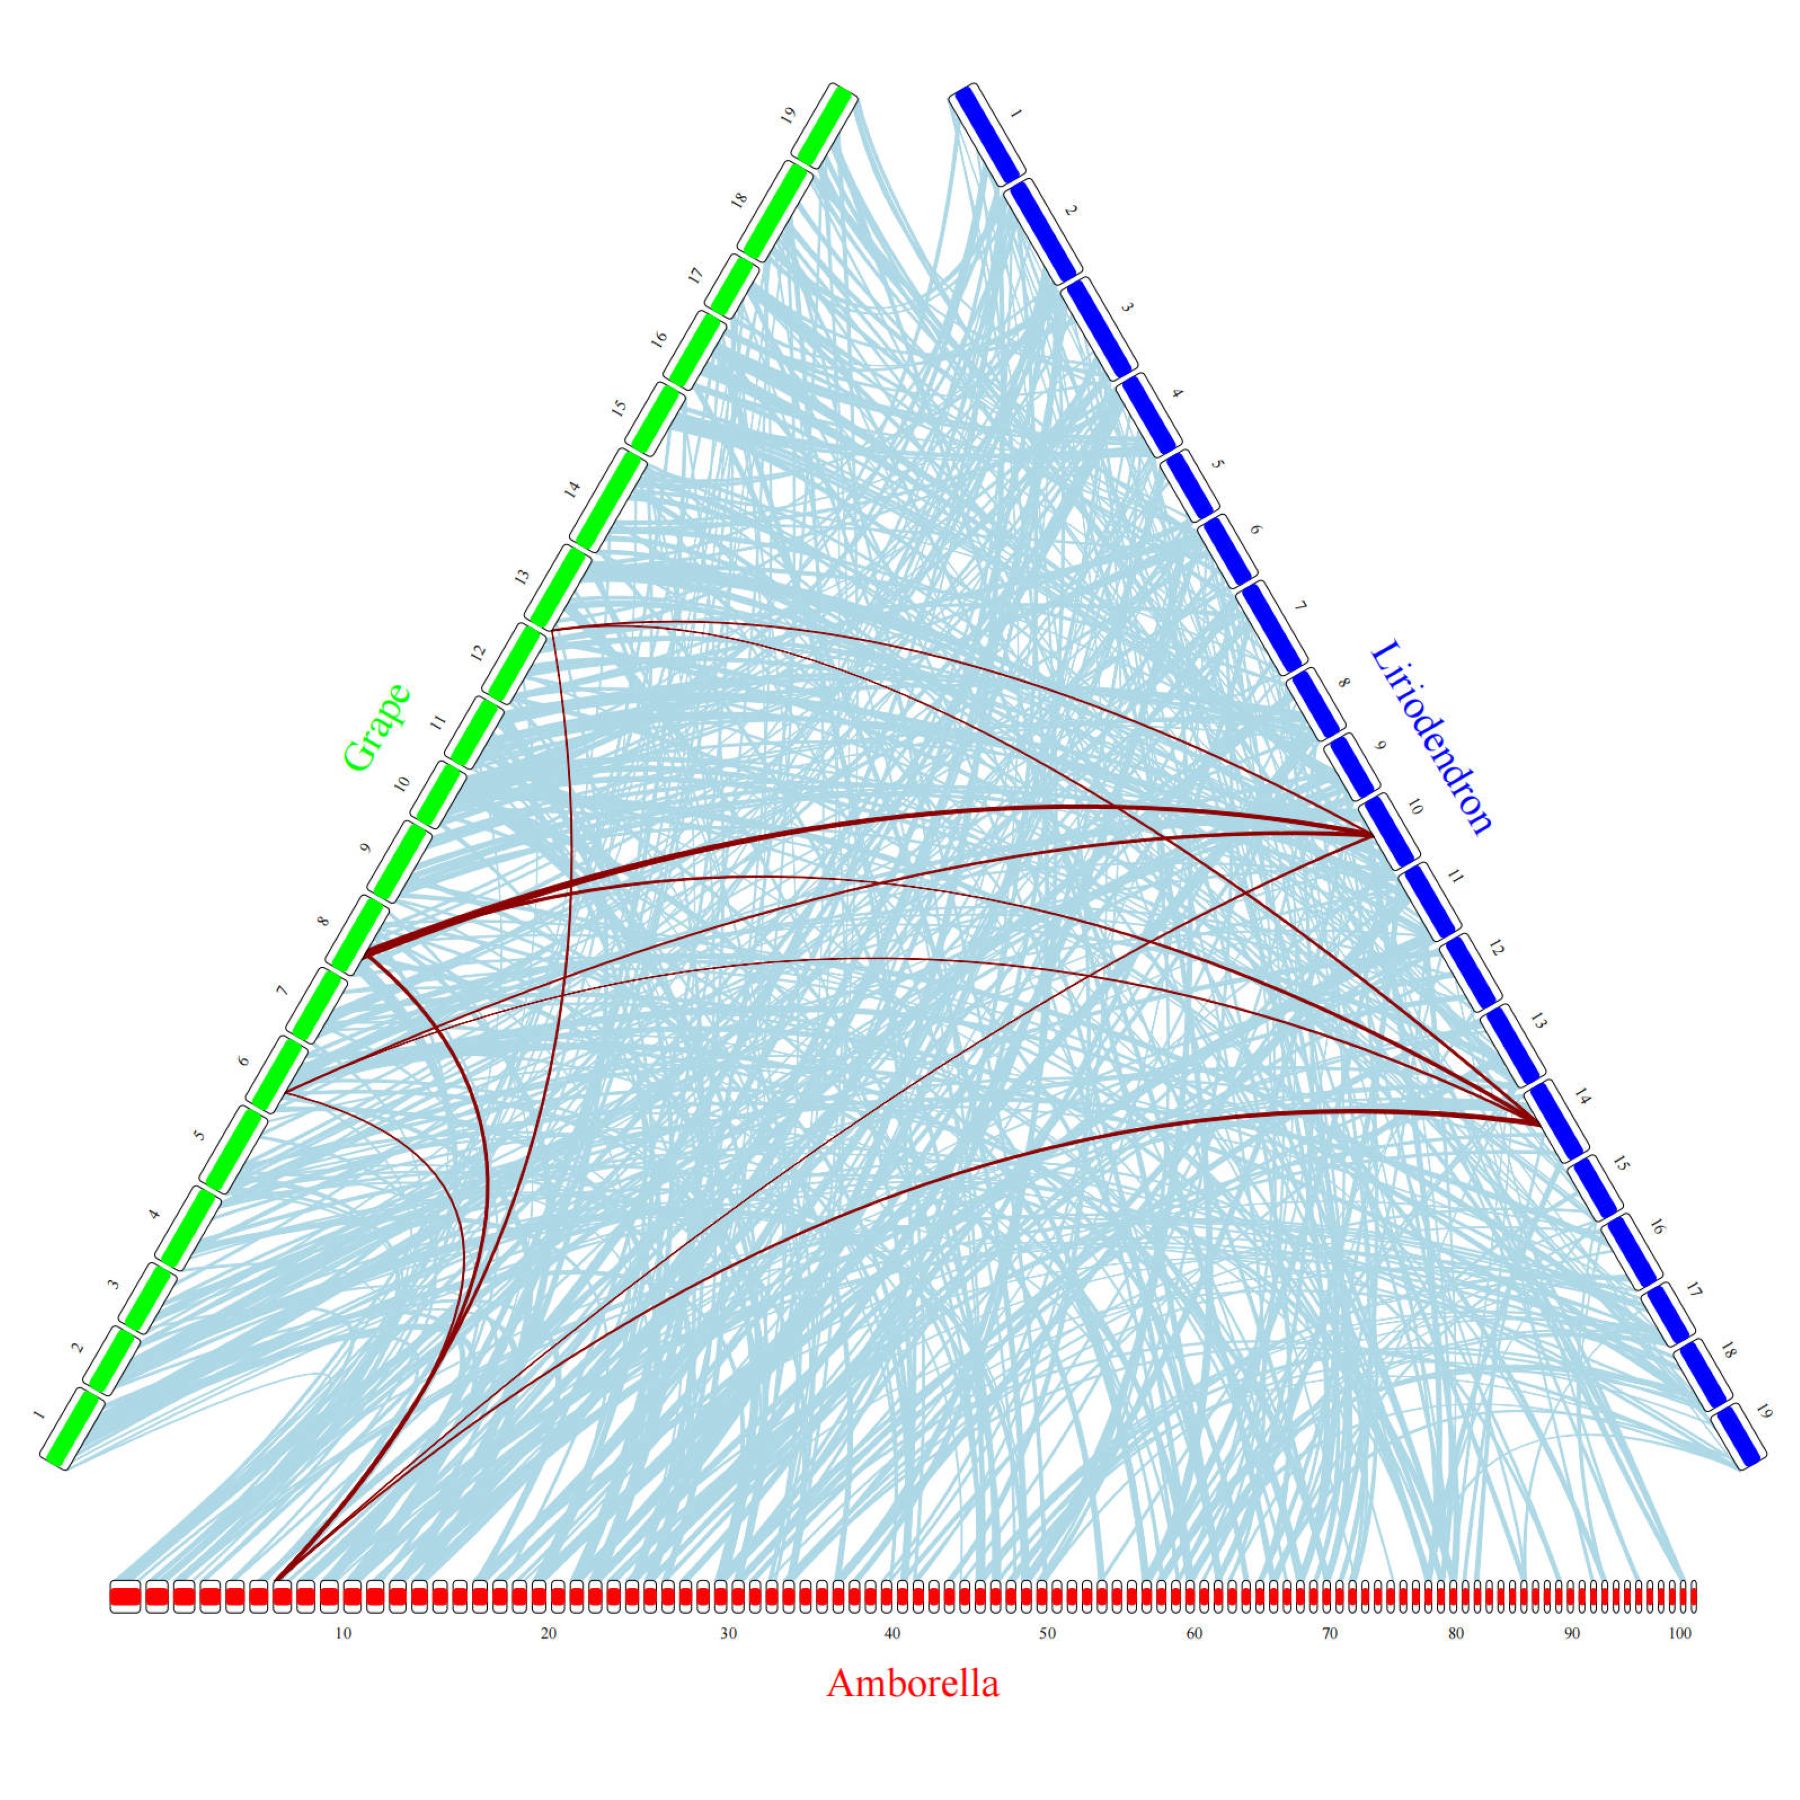
应用
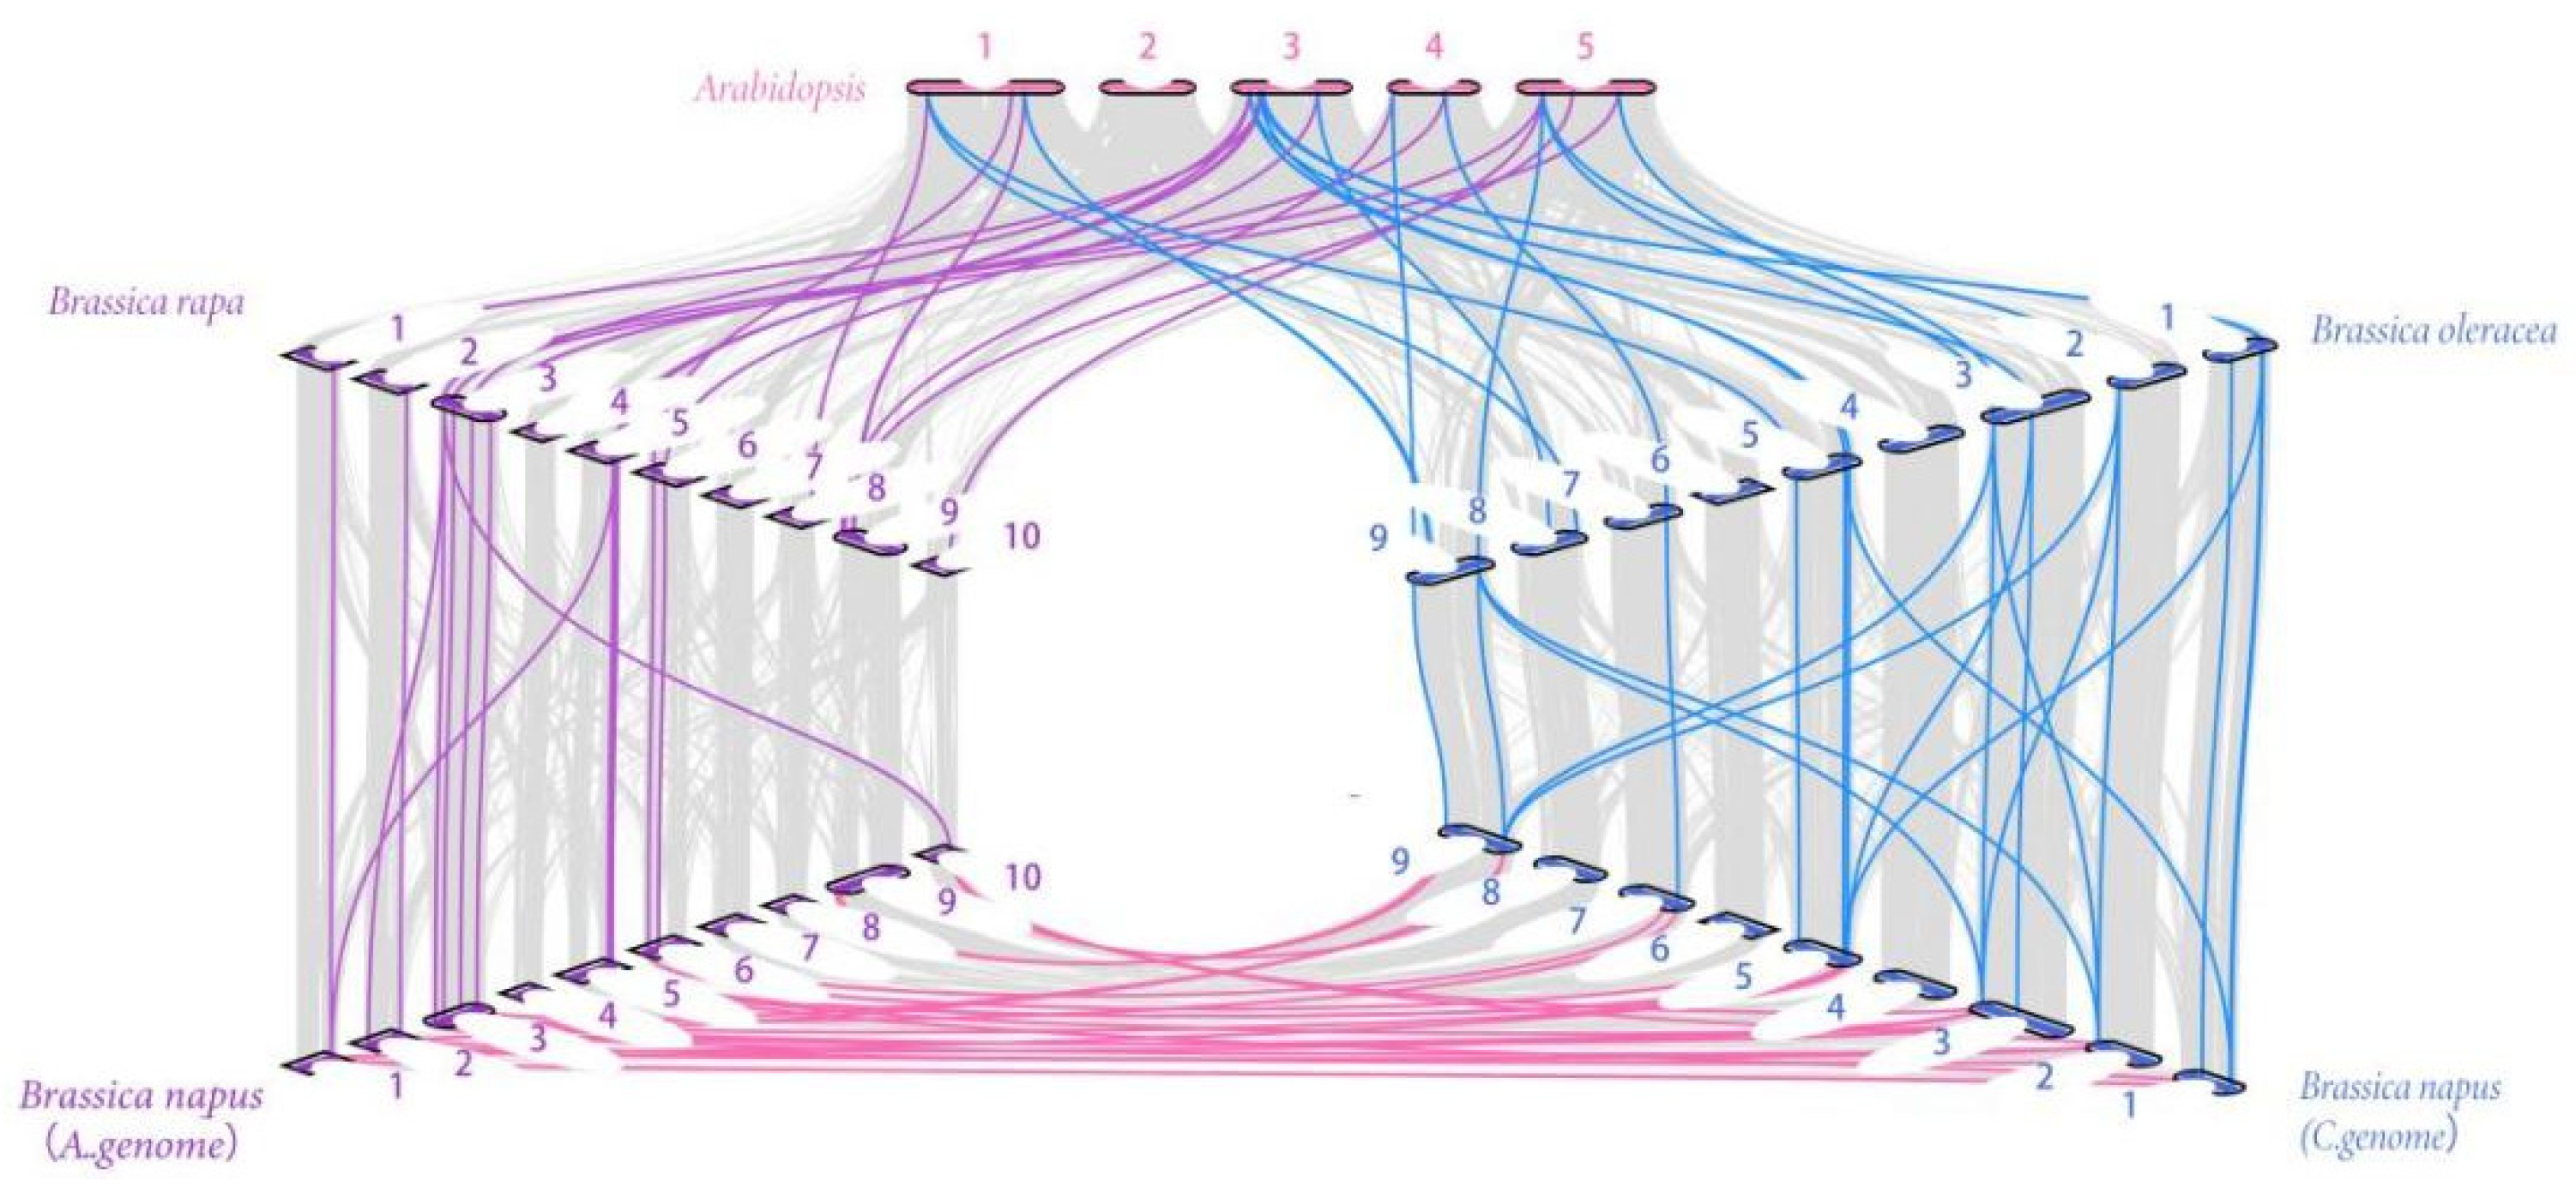
该图展示了 R2R3-MYB 基因在 B. napus 和 3 个祖先植物物种中的同源关系。图中显示了 Arabidopsis (A. thaliana)、Brassica rapa (B. rapa)、Brassica oleracea (B. oleracea)、Brassica napus (B. napus) 之间的共线性。[1]
参考资料
[1] Luo D, Mei D, Wei W, Liu J. Identification and Phylogenetic Analysis of the R2R3-MYB Subfamily in Brassica napus. Plants (Basel). 2023;12(4):886. Published 2023 Feb 16. doi:10.3390/plants12040886