# 安装包
if (!requireNamespace("metafor", quietly = TRUE)) {
  install.packages("metafor")
}
if (!requireNamespace("ggplotify", quietly = TRUE)) {
  install.packages("ggplotify")
}

# 加载包
library(metafor)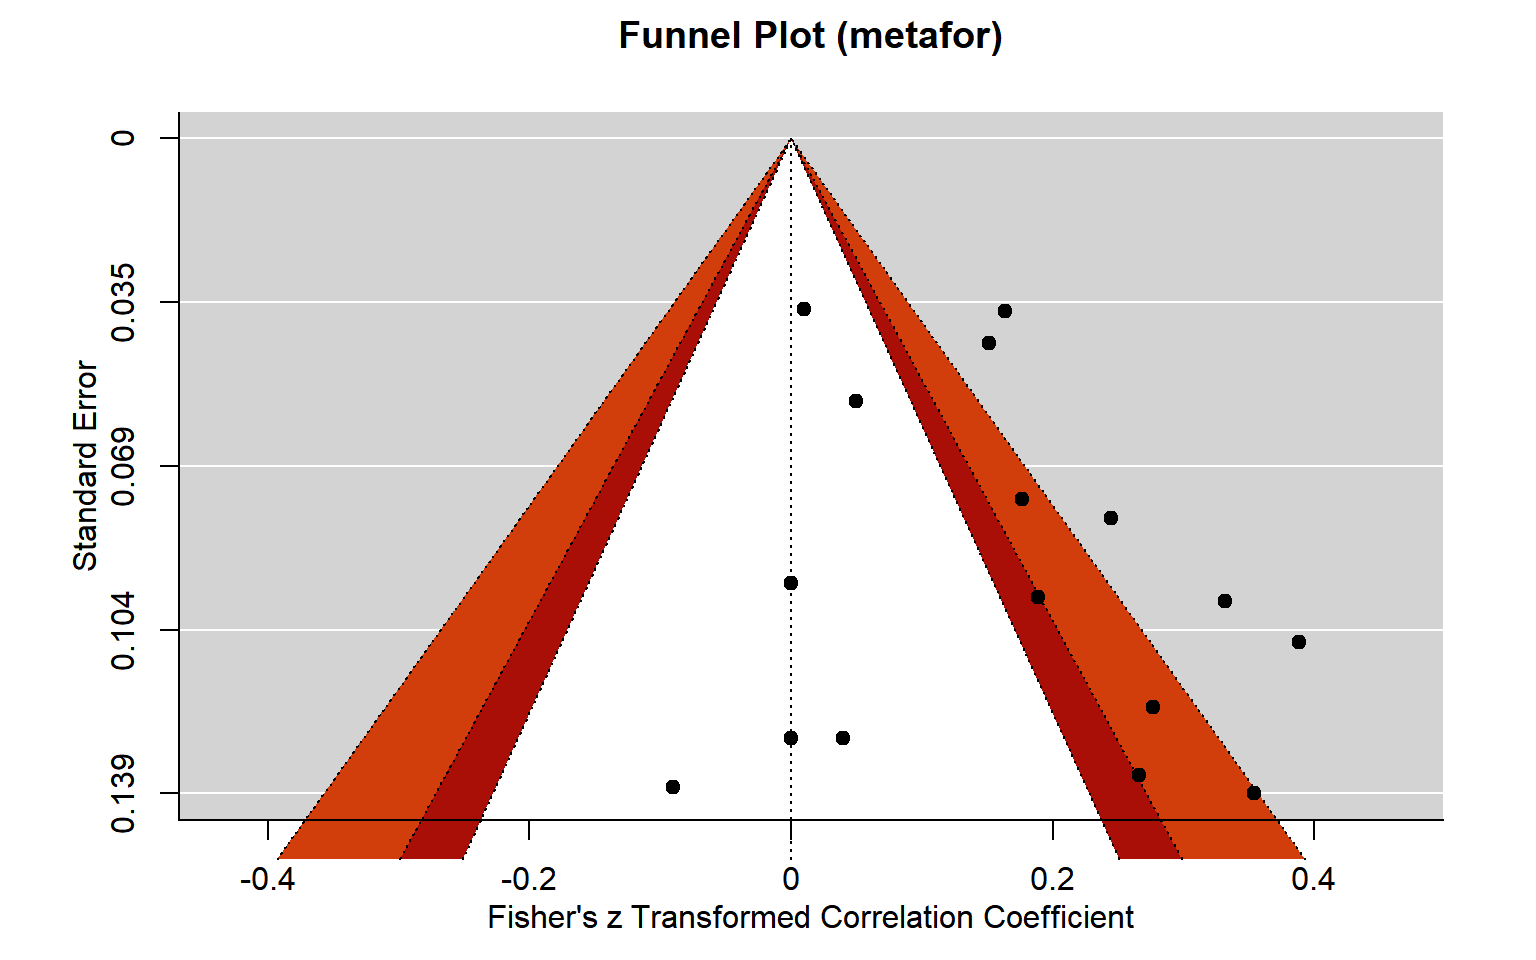
library(ggplotify)漏斗图 (metafor)
注记
Hiplot 网站
本页面为 Hiplot Funnel Plot (metafor) 插件的源码版本教程,您也可以使用 Hiplot 网站实现无代码绘图,更多信息请查看以下链接:
可以用于分析 Meta 分析结果中潜在偏倚因子。
环境配置
系统: Cross-platform (Linux/MacOS/Windows)
编程语言: R
依赖包:
metafor;ggplotify
数据准备
# 加载数据
data <- read.delim("files/Hiplot/057-funnel-plot-metafor-data.txt", header = T)

# 整理数据格式
data2 <- escalc(ri=ri, ni=ni, data = data, measure="ZCOR")
res <- rma(yi, vi, data = data2)

# 查看数据
head(data2)
              authors year  ni    ri controls          design   a_measure
1     Axelsson et al. 2009 109 0.187     none cross-sectional self-report
2     Axelsson et al. 2011 749 0.162     none cross-sectional self-report
3        Bruce et al. 2010  55 0.340     none     prospective       other
4  Christensen et al. 1999 107 0.320     none cross-sectional self-report
5 Christensen & Smith 1995  72 0.270     none     prospective       other
6        Cohen et al. 2004  65 0.000     none     prospective       other
  c_measure meanage quality     yi     vi
1     other   22.00       1 0.1892 0.0094
2       NEO   53.59       1 0.1634 0.0013
3       NEO   43.36       2 0.3541 0.0192
4     other   41.70       1 0.3316 0.0096
5       NEO   46.39       2 0.2769 0.0145
6       NEO   41.20       2 0.0000 0.0161
可视化
# 漏斗图
p <- as.ggplot(function(){
  funnel(x = res, main = "Funnel Plot (metafor)",
         level = c(90, 95, 99), shade = c("white","#a90e07","#d23e0b"), refline = 0)
  })

p