# 安装包
if (!requireNamespace("ggplot2", quietly = TRUE)) {
  install.packages("ggplot2")
}

# 加载包
library(ggplot2)条码图
注记
Hiplot 网站
本页面为 Hiplot Barcode Plot 插件的源码版本教程,您也可以使用 Hiplot 网站实现无代码绘图,更多信息请查看以下链接:
条码图适用于展示大量数据的分布情况。
环境配置
系统: Cross-platform (Linux/MacOS/Windows)
编程语言: R
依赖包:
ggplot2
数据准备
案例数据为某商品在三个地区各500个门店的销售额。
# 加载数据
data <- read.table("files/Hiplot/002-barcode-plot-data.txt", header = T)
# 查看数据
head(data)
region sales
1 GuangDong 42.54612
2 GuangDong 46.26102
3 GuangDong 46.00448
4 GuangDong 45.05684
5 GuangDong 48.67611
6 GuangDong 56.95071可视化
# 条码图
p <- ggplot(data, aes(x = sales, y = region)) +
  geom_tile(width = 0.01, height = 0.9, fill = "#606fcc") + # 控制条带的宽度和高度
  theme_bw() +
  labs(title = "Sales report", x = "Sales", y = "Region") +
  theme(text = element_text(family = "Arial"),
        plot.title = element_text(size = 12,hjust = 0.5),
        axis.title = element_text(size = 12),
        axis.text = element_text(size = 10),
        axis.text.x = element_text(angle = 0, hjust = 0.5,vjust = 1),
        legend.position = "right",
        legend.direction = "vertical",
        legend.title = element_text(size = 10),
        legend.text = element_text(size = 10))

p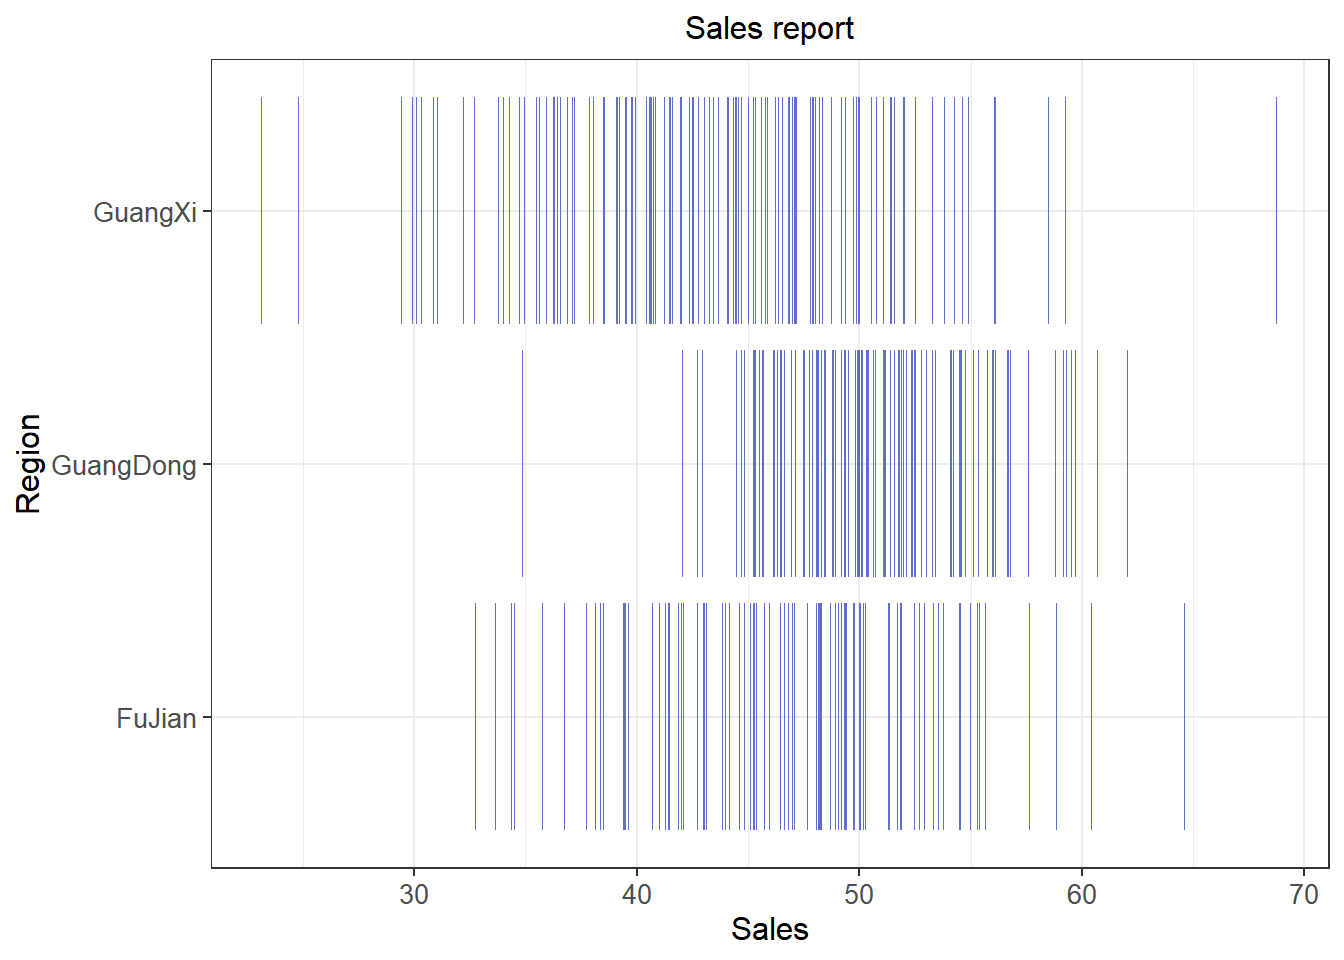
通过条码图可以看到该商品在广东和福建地区销售额分布在50左右的门店数量较多,且在广东各门店之间销售额差异较小,分布较集中。
提示
特殊参数:
- width:条带宽度
- height:条带高度
- color:条带颜色