# 安装包
if (!requireNamespace("packcircles", quietly = TRUE)) {
  install.packages("packcircles")
}
if (!requireNamespace("ggplot2", quietly = TRUE)) {
  install.packages("ggplot2")
}
if (!requireNamespace("viridis", quietly = TRUE)) {
  install.packages("viridis")
}

# 加载包
library(packcircles)
library(ggplot2)
library(viridis)圆堆图
注记
Hiplot 网站
本页面为 Hiplot Circle Packing 插件的源码版本教程,您也可以使用 Hiplot 网站实现无代码绘图,更多信息请查看以下链接:
用于展示不同类型之间的数量差异。
环境配置
系统: Cross-platform (Linux/MacOS/Windows)
编程语言: R
依赖包:
packcircles;ggplot2;viridis
数据准备
# 加载数据
data <- read.table("files/Hiplot/021-circle-packing-data.txt", header = T)
# 整理数据格式
packing <- circleProgressiveLayout(data[["v"]], sizetype = "area")
data <- cbind(data, packing)
dat_gg <- circleLayoutVertices(packing, npoints = 50)
colors <- c("#E57164","#F8ECA7","#9389C1","#3F9C78","#769F8D","#E5F9A9","#7CE9A4",
"#CE9FCA","#78F197","#8BB085","#D88880","#A6E4C3","#F7F6B1","#C5E69A",
"#F45FDE","#5CF371","#9259CF","#2B6D9B","#F3C096","#EEADBE")
dat_gg$value <- rep(colors, each = 51)
# 查看数据
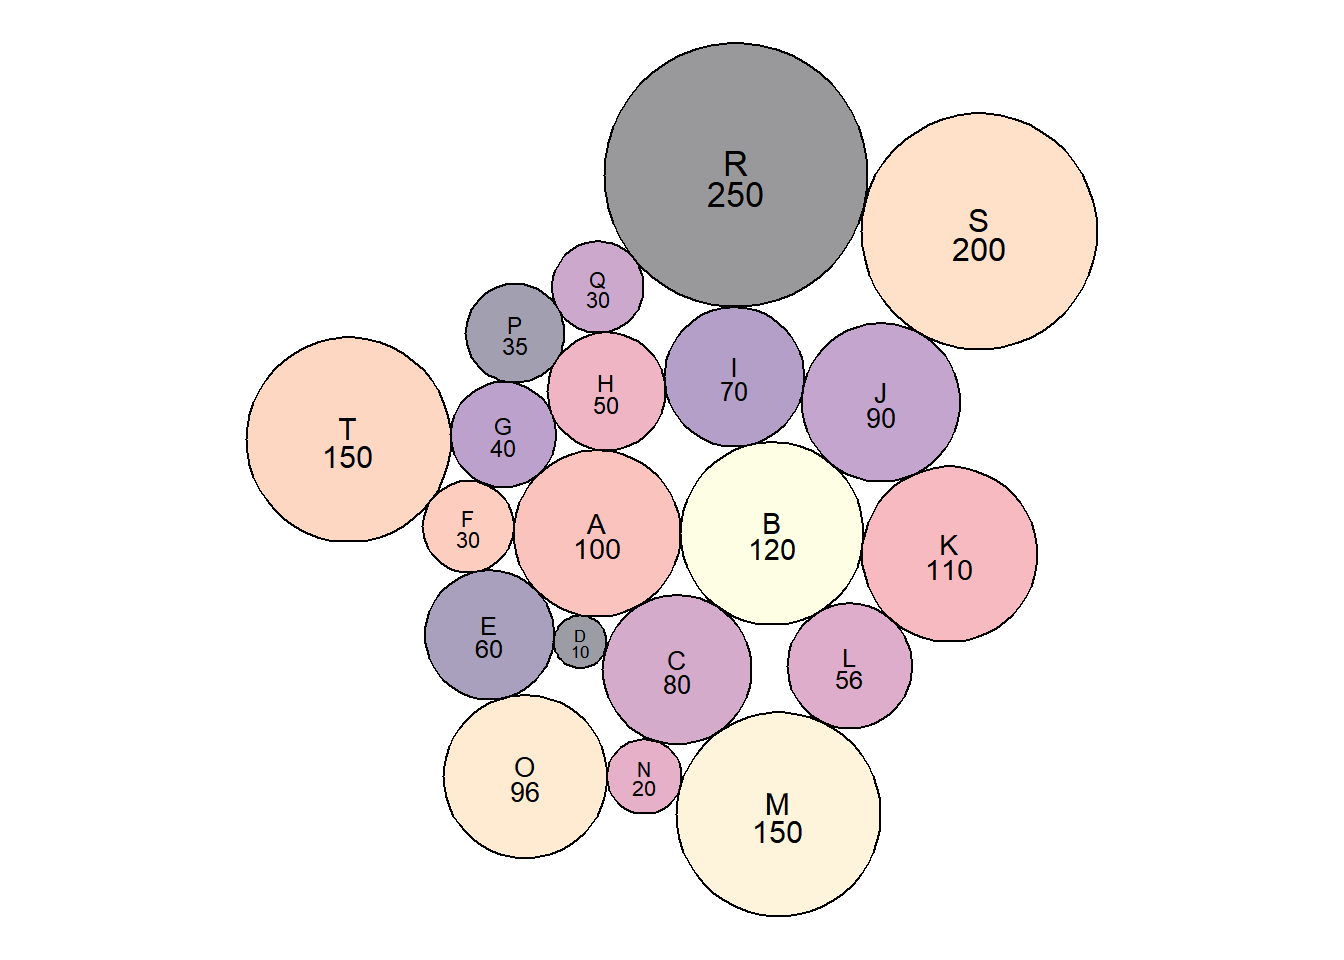
head(data) g v x y radius
1 A 100 -5.6418958 0.0000000 5.641896
2 B 120 6.1803872 0.0000000 6.180387
3 C 80 -0.2298516 -9.2166458 5.046265
4 D 10 -6.7961670 -7.3357638 1.784124
5 E 60 -12.9322538 -6.8624061 4.370194
6 F 30 -14.3618753 0.4597221 3.090194可视化
# 圆堆图
p <- ggplot() +
  geom_polygon(data = dat_gg, aes(x, y, group = id, fill = value), colour = "black", alpha = 0.4) +
  scale_fill_manual(values = magma(nrow(data))) +
  theme_void() +
  theme(legend.position = "none") +
  coord_equal() +
  scale_size_continuous(range = c(2.3, 4.5)) +
  geom_text(data = data, aes(x, y, size = v, label = g), vjust = 0) +
  geom_text(data = data, aes(x, y, label = v, size = v), vjust = 1.2)

p