# 安装包
if (!requireNamespace("ggplot2", quietly = TRUE)) {
  install.packages("ggplot2")
}
if (!requireNamespace("ggalt", quietly = TRUE)) {
  install.packages("ggalt")
}

# 加载包
library(ggplot2)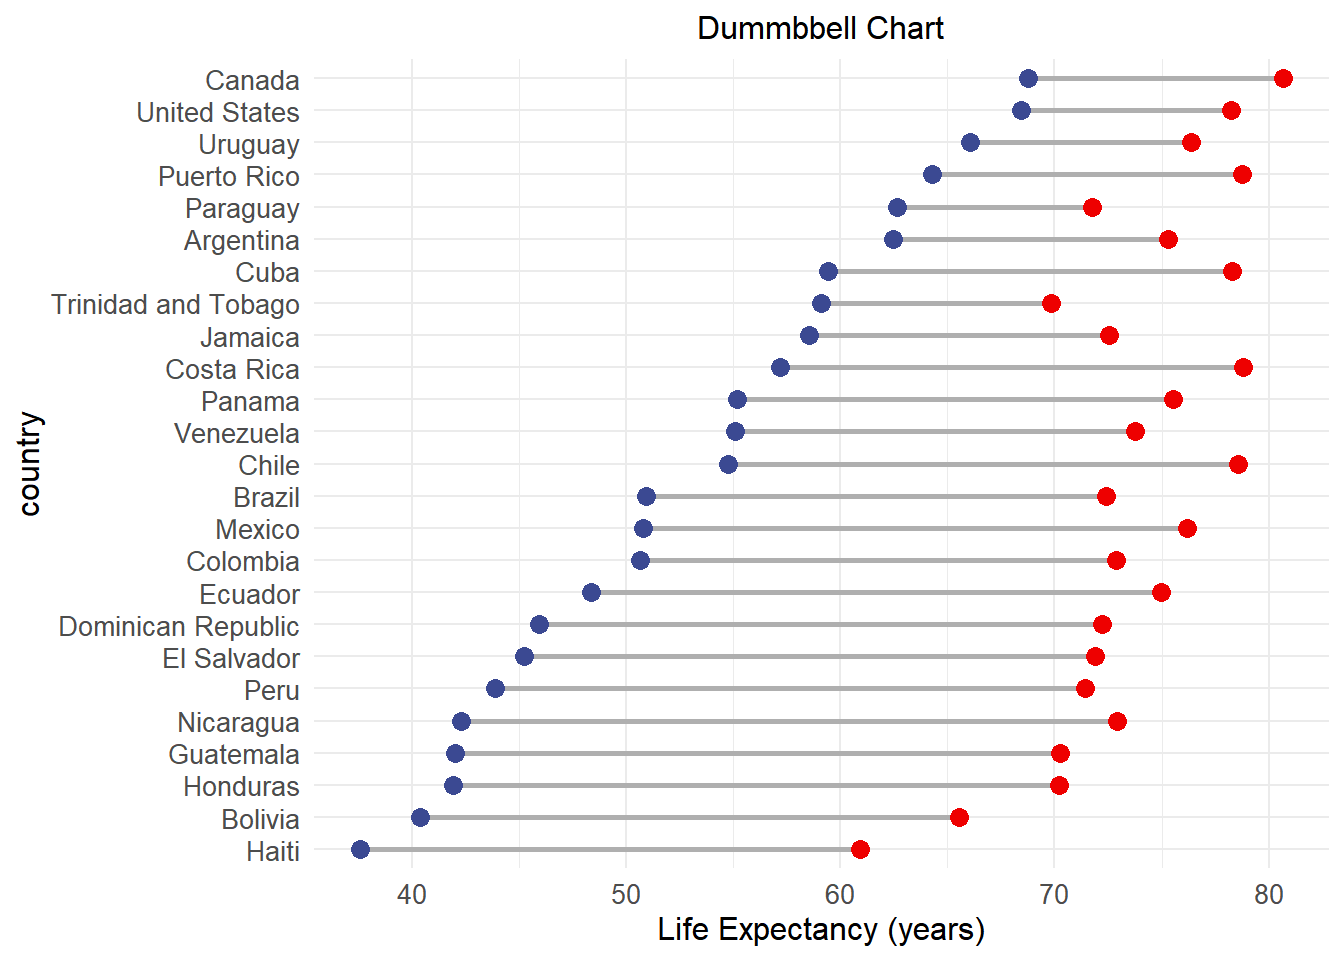
library(ggalt)哑铃图
注记
Hiplot 网站
本页面为 Hiplot Dumbbell Chart 插件的源码版本教程,您也可以使用 Hiplot 网站实现无代码绘图,更多信息请查看以下链接:
哑铃图用于展示数据变化。
环境配置
系统: Cross-platform (Linux/MacOS/Windows)
编程语言: R
依赖包:
ggplot2;ggalt
数据准备
# 加载数据
data <- read.delim("files/Hiplot/048-dumbbell-data.txt", header = T)

# 查看数据
head(data)
country y1952 y2007
1 Argentina 62.485 75.320
2 Bolivia 40.414 65.554
3 Brazil 50.917 72.390
4 Canada 68.750 80.653
5 Chile 54.745 78.553
6 Colombia 50.643 72.889可视化
# 哑铃图
colors <- c("#3B4992FF","#EE0000FF")
p <- ggplot(data, aes(y = reorder(country, y1952), x = y1952, xend = y2007)) +
  geom_dumbbell(size = 1, size_x = 3,  size_xend = 3, colour = "#AFAFAF",
                colour_x = colors[1],  colour_xend = colors[2]) +
  labs(title = "Dummbbell Chart", x = "Life Expectancy (years)",
       y = "country") +
  theme_minimal() +
  theme(text = element_text(family = "Arial"),
        plot.title = element_text(size = 12,hjust = 0.5),
        axis.title = element_text(size = 12),
        axis.text = element_text(size = 10),
        axis.text.x = element_text(angle = 0, hjust = 0.5,vjust = 1),
        legend.position = "right",
        legend.direction = "vertical",
        legend.title = element_text(size = 10),
        legend.text = element_text(size = 10))

p