# 安装包
if (!requireNamespace("ggplot2", quietly = TRUE)) {
  install.packages("ggplot2")
}

# 加载包
library(ggplot2)分组气泡图
注记
Hiplot 网站
本页面为 Hiplot Group Bubble 插件的源码版本教程,您也可以使用 Hiplot 网站实现无代码绘图,更多信息请查看以下链接:
环境配置
系统: Cross-platform (Linux/MacOS/Windows)
编程语言: R
依赖包:
ggplot2
数据准备
# 加载数据
data <- read.delim("files/Hiplot/081-group-bubble-data.txt", header = T)

# 查看数据
head(data)
Sepal.Length Sepal.Width Petal.Length Petal.Width Species
1 5.1 3.5 1.4 0.2 setosa
2 4.9 3.0 1.4 0.2 setosa
3 4.7 3.2 1.3 0.2 setosa
4 4.6 3.1 1.5 0.2 setosa
5 5.0 3.6 1.4 0.2 setosa
6 5.4 3.9 1.7 0.4 setosa可视化
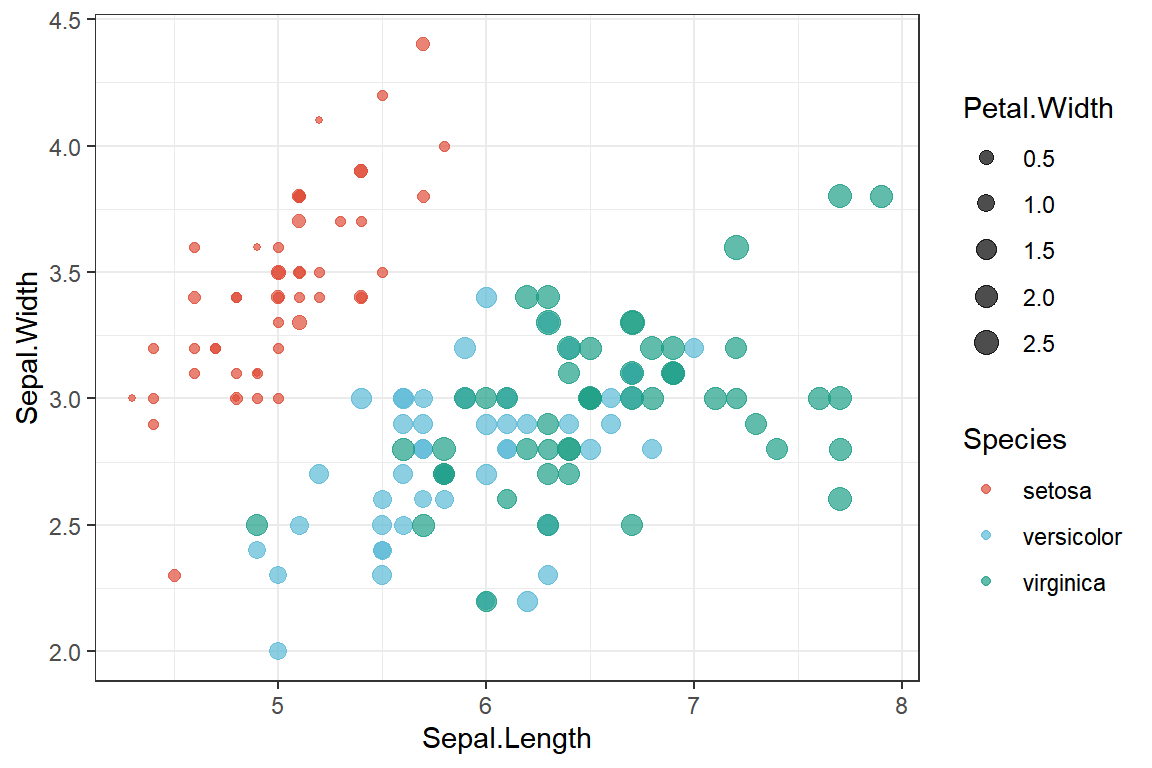
# 分组气泡图
p <- ggplot(data = data, aes(x = Sepal.Length, y = Sepal.Width,
                             size = Petal.Width, color = Species)) +
  geom_point(alpha = 0.7) +
  scale_size(range = c(1, 4)) +
  scale_color_manual(values = c("#e04d39","#5bbad6","#1e9f86")) +
  theme_bw()

p