# 安装包
if (!requireNamespace("ggstatsplot", quietly = TRUE)) {
  install.packages("ggstatsplot")
}
if (!requireNamespace("ggplot2", quietly = TRUE)) {
  install.packages("ggplot2")
}

# 加载包
library(ggstatsplot)
library(ggplot2)饼状图(ggpiestats)
注记
Hiplot 网站
本页面为 Hiplot Piestats 插件的源码版本教程,您也可以使用 Hiplot 网站实现无代码绘图,更多信息请查看以下链接:
环境配置
系统: Cross-platform (Linux/MacOS/Windows)
编程语言: R
依赖包:
ggstatsplot;ggplot2
数据准备
# 加载数据
data <- read.delim("files/Hiplot/071-ggpiestats-data.txt", header = T)

# 整理数据格式
axis <- c("am", "cyl")
data[, axis[1]] <- factor(data[, axis[1]], levels = unique(data[, axis[1]]))
data[, axis[2]] <- factor(data[, axis[2]], levels = unique(data[, axis[2]]))

# 查看数据
head(data)
mpg cyl disp hp drat wt qsec vs am gear carb
1 21.0 6 160 110 3.90 2.620 16.46 0 1 4 4
2 21.0 6 160 110 3.90 2.875 17.02 0 1 4 4
3 22.8 4 108 93 3.85 2.320 18.61 1 1 4 1
4 21.4 6 258 110 3.08 3.215 19.44 1 0 3 1
5 18.7 8 360 175 3.15 3.440 17.02 0 0 3 2
6 18.1 6 225 105 2.76 3.460 20.22 1 0 3 1可视化
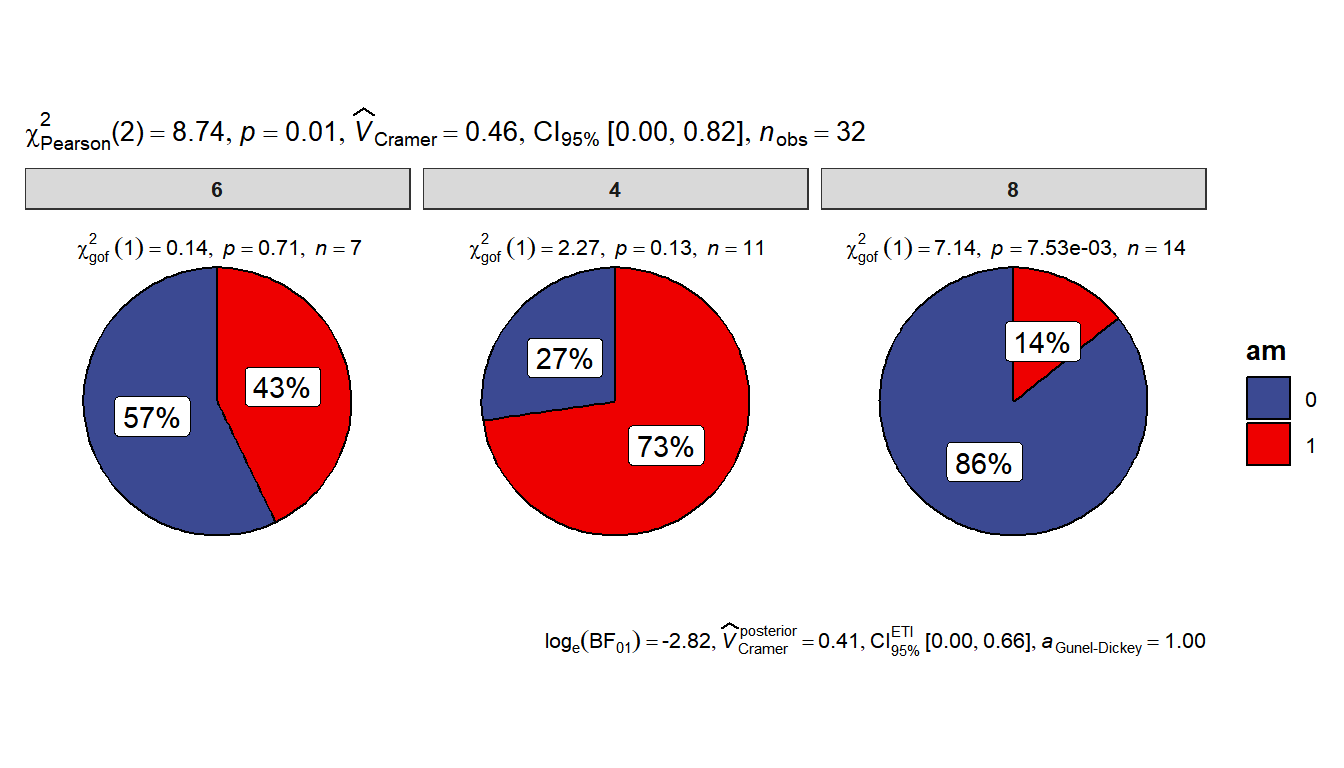
# 饼状图
p <- ggpiestats(data = data, x = am, y = cyl,
                paired = F) +
  scale_fill_manual(values = c("#3B4992FF","#EE0000FF"))

p