# 安装包
if (!requireNamespace("eulerr", quietly = TRUE)) {
  install.packages("eulerr")
}
if (!requireNamespace("ggplotify", quietly = TRUE)) {
  install.packages("ggplotify")
}

# 加载包
library(eulerr)
library(ggplotify)比例韦恩图
注记
Hiplot 网站
本页面为 Hiplot Eulerr Plot 插件的源码版本教程,您也可以使用 Hiplot 网站实现无代码绘图,更多信息请查看以下链接:
环境配置
系统: Cross-platform (Linux/MacOS/Windows)
编程语言: R
依赖包:
eulerr;ggplotify
数据准备
# 加载数据
data <- read.delim("files/Hiplot/051-eulerr-data.txt", header = T)
# 整理数据格式
genes <- as.numeric(data[, 2])
names(genes) <- as.character(data[, 1])
euler_set <- euler(genes)
# 查看数据
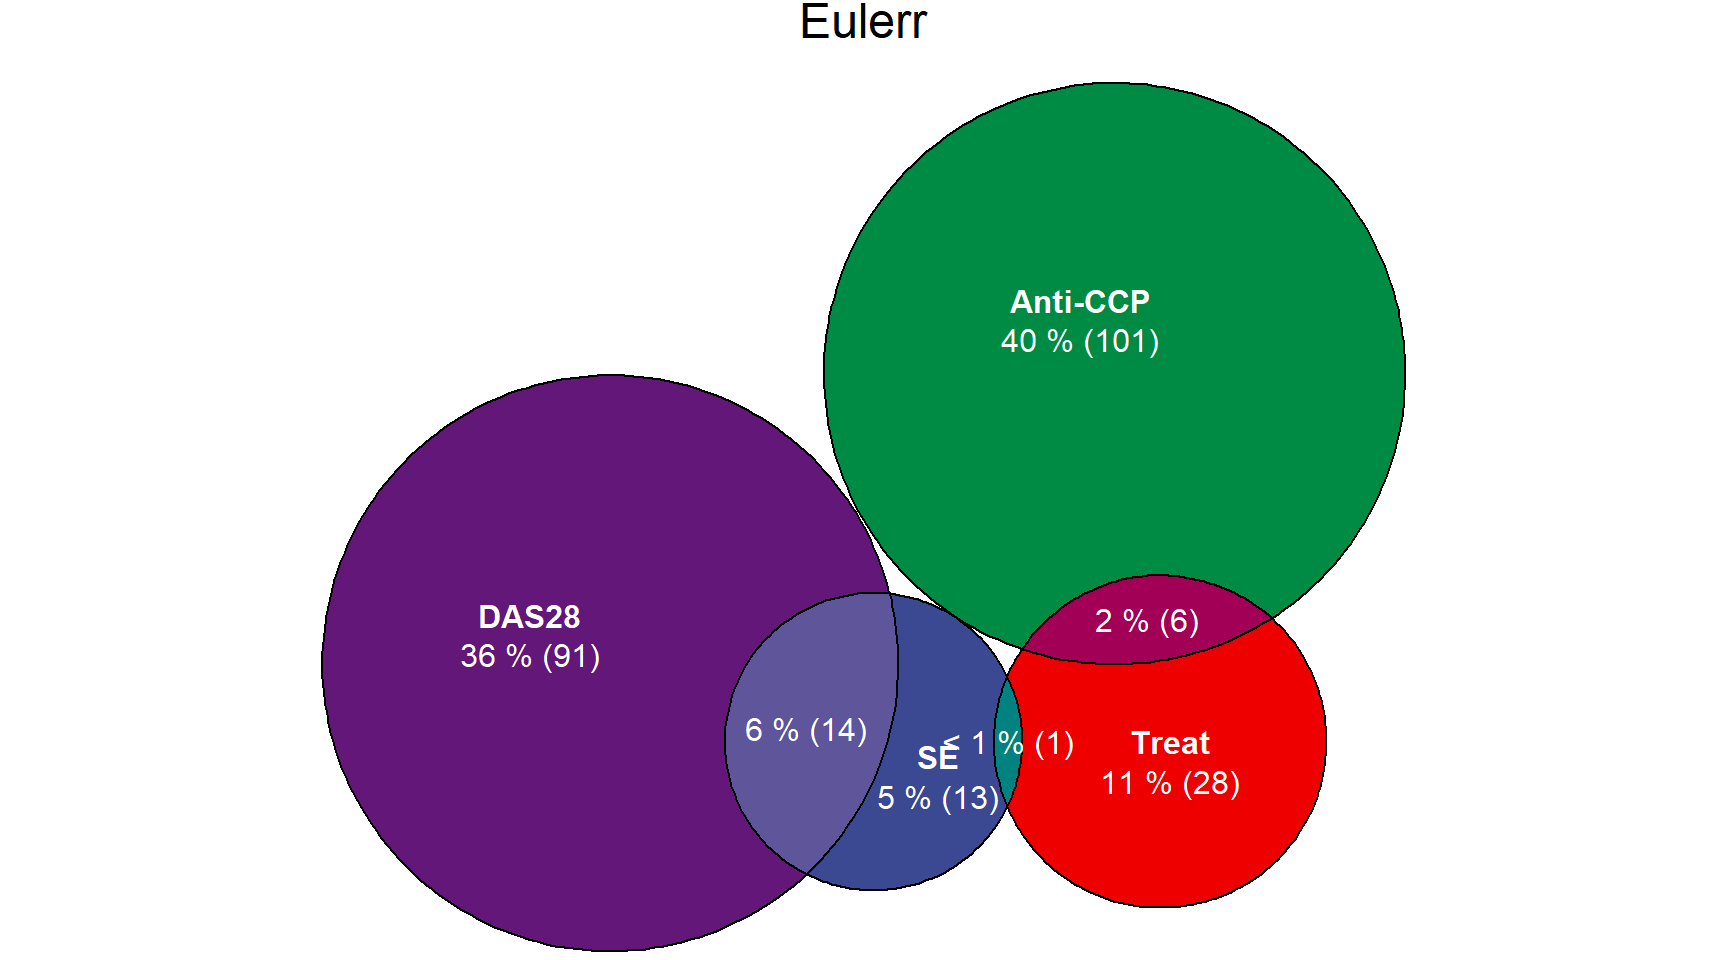
head(data) Term Value
1 SE 13
2 Treat 28
3 Anti-CCP 101
4 DAS28 91
5 SE&Treat 1
6 SE&DAS28 14可视化
# 比例韦恩图
fill <- c("#3B4992FF","#EE0000FF","#008B45FF","#631879FF","#008280FF","#BB0021FF",
          "#5F559BFF","#A20056FF")
p <- as.ggplot(
  plot(euler_set,
    labels = list(col = rep("white", length(genes))),
    fills = list(fill = fill),
    quantities = list(type = c("percent", "counts"),
    col = rep("white", length(genes))),
    main = "Eulerr")
)

p