# Install packages
if (!requireNamespace("fishplot", quietly = TRUE)) {
  install_github("chrisamiller/fishplot")
}

# Load packages
library(fishplot)Fishplot
Note
Hiplot website
This page is the tutorial for source code version of the Hiplot Fishplot plugin. You can also use the Hiplot website to achieve no code ploting. For more information please see the following link:
Clone evolution analysis
Setup
System Requirements: Cross-platform (Linux/MacOS/Windows)
Programming language: R
Dependent packages:
fishplot
Data Preparation
# Load data
data <- read.delim("files/Hiplot/055-fishplot-data.txt", header = T)
# View data
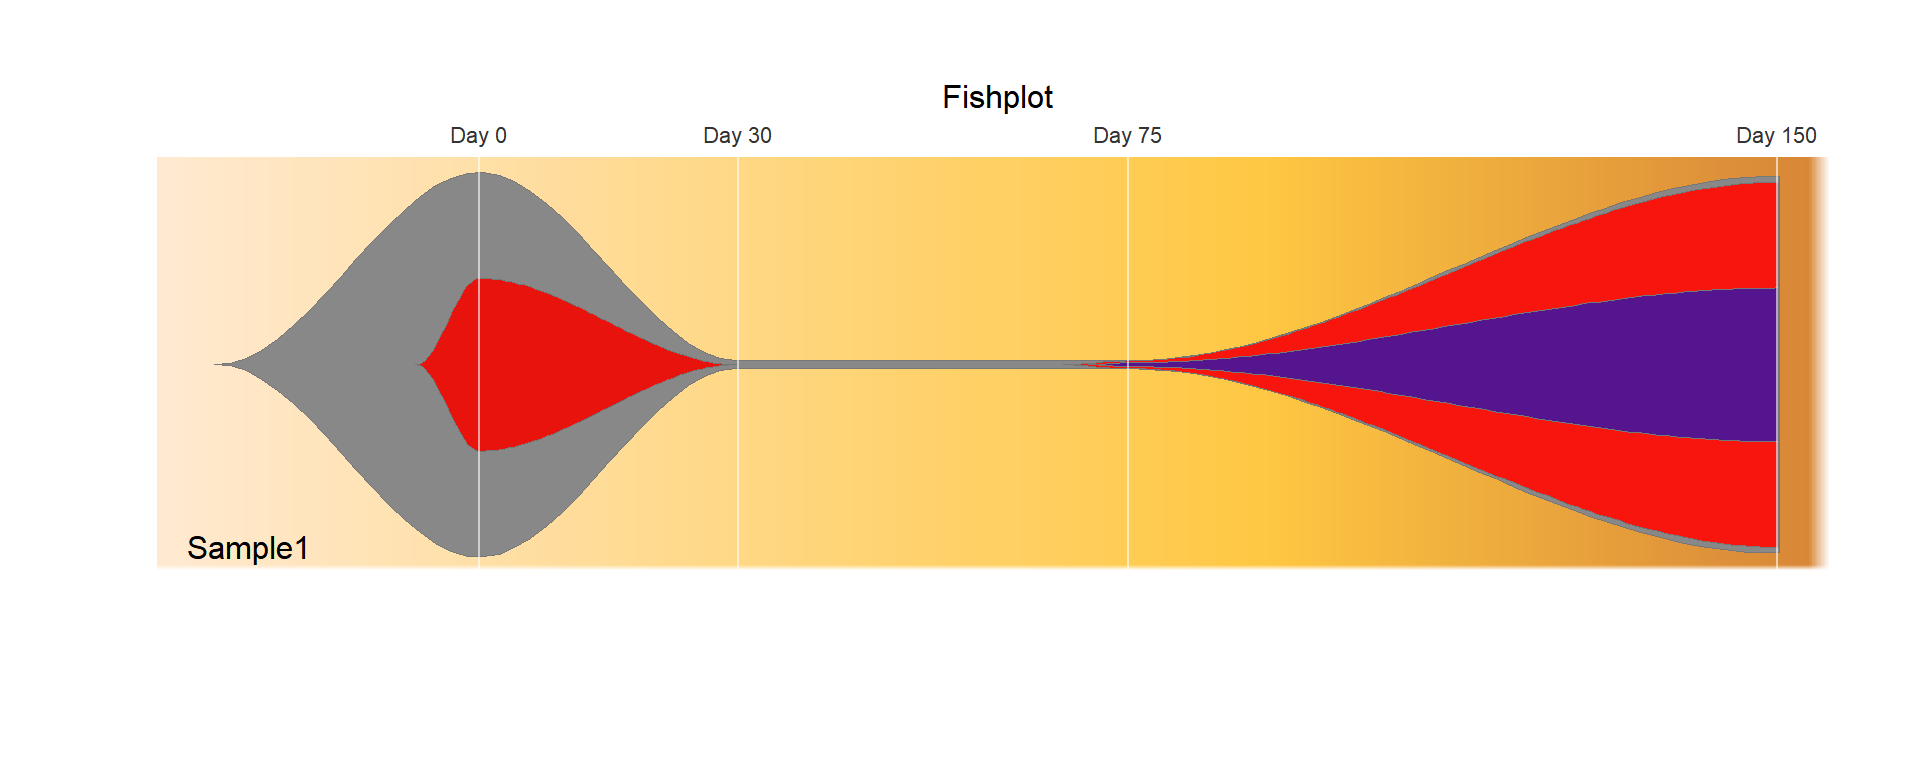
head(data) timepoints parents sample.name event1 event2 event3 event4
1 0 0 Sample1 100 2 2 98
2 30 1 Sample1 45 0 0 0
3 75 1 Sample1 0 0 2 95
4 150 3 Sample1 0 0 1 40timepoints: specifying the timepoints for each column of the matrix
parents: specifying parental relationships between clones
samplename: samplename (support multiple samples)
other: a numeric matrix containing tumor fraction estimates for all clones at all timepoints
Visualization
## Create a fish object
fish = createFishObject(as.matrix(data[,4:7]), parents=data$parents,
                        timepoints=data$timepoints,
                        col = c("#888888","#e8130c","#f8150d","#55158f"))
## Calculate the layout of the drawing
fish = layoutClones(fish)
## Draw the plot, using the splining method (recommended), and providing both timepoints to label and a plot title
fishPlot(fish,shape="spline", title.btm="Sample1", title = "Fishplot",
         cex.title=1, vlines=c(0,30,75,150),
         vlab=c("Day 0","Day 30","Day 75","Day 150"))