# Install packages
if (!requireNamespace("metafor", quietly = TRUE)) {
  install.packages("metafor")
}
if (!requireNamespace("ggplotify", quietly = TRUE)) {
  install.packages("ggplotify")
}

# Load packages
library(metafor)
library(ggplotify)Funnel Plot (metafor)
Note
Hiplot website
This page is the tutorial for source code version of the Hiplot Funnel Plot (metafor) plugin. You can also use the Hiplot website to achieve no code ploting. For more information please see the following link:
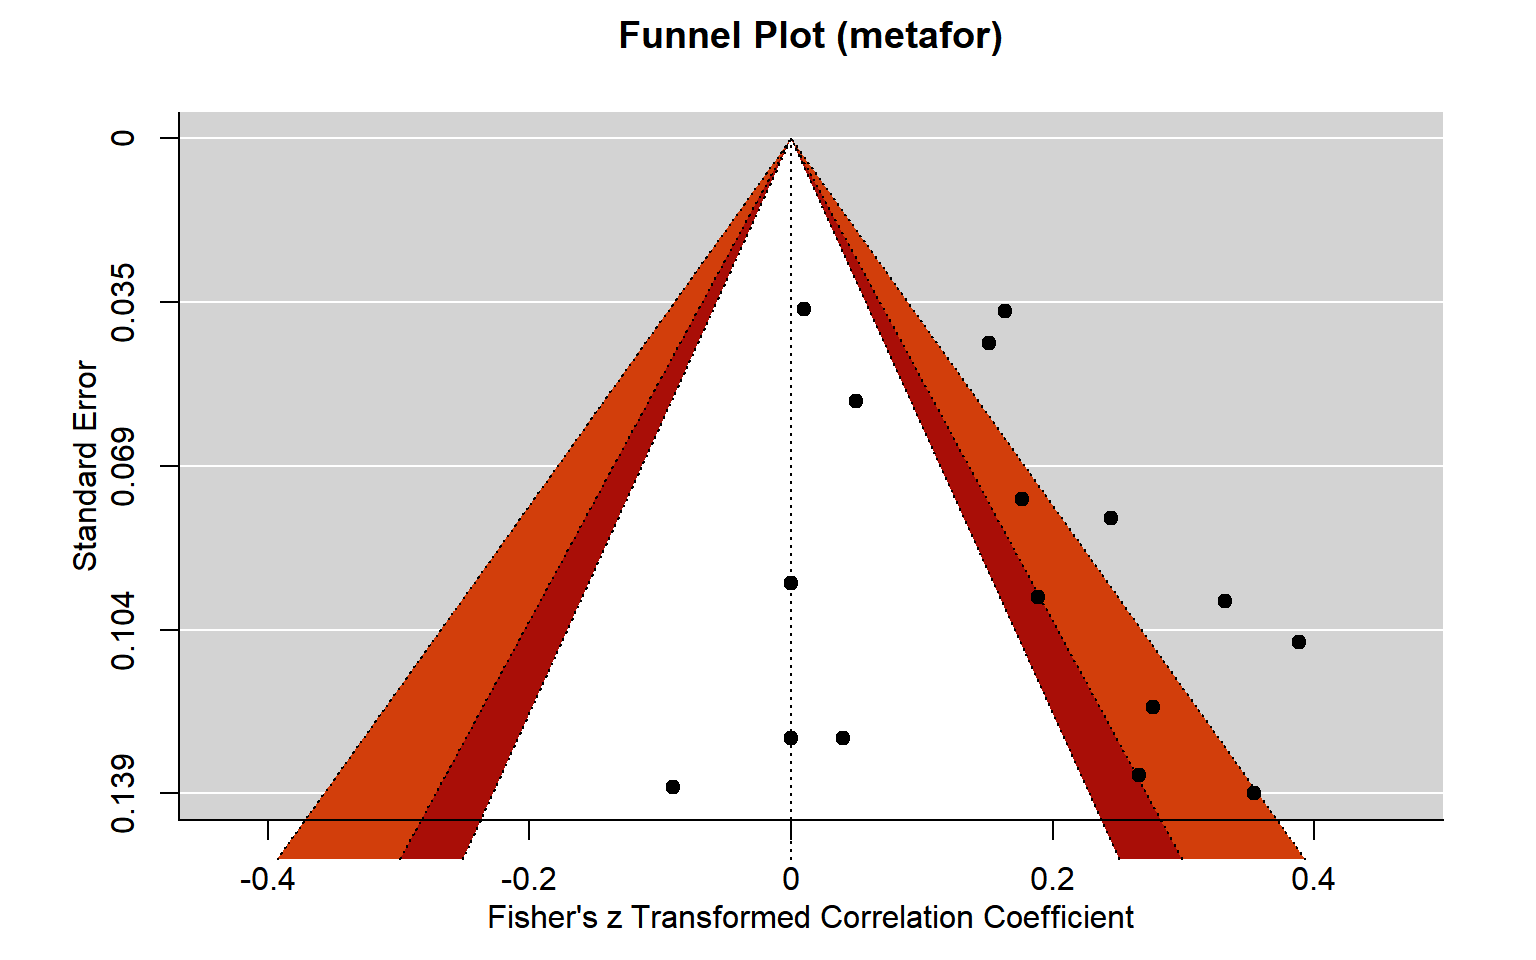
Can be used to show potential bias factors in Meta-analysis.
Setup
System Requirements: Cross-platform (Linux/MacOS/Windows)
Programming language: R
Dependent packages:
metafor;ggplotify
Data Preparation
# Load data
data <- read.delim("files/Hiplot/057-funnel-plot-metafor-data.txt", header = T)

# Convert data structure
data2 <- escalc(ri=ri, ni=ni, data = data, measure="ZCOR")
res <- rma(yi, vi, data = data2)

# View data
head(data2)
              authors year  ni    ri controls          design   a_measure
1     Axelsson et al. 2009 109 0.187     none cross-sectional self-report
2     Axelsson et al. 2011 749 0.162     none cross-sectional self-report
3        Bruce et al. 2010  55 0.340     none     prospective       other
4  Christensen et al. 1999 107 0.320     none cross-sectional self-report
5 Christensen & Smith 1995  72 0.270     none     prospective       other
6        Cohen et al. 2004  65 0.000     none     prospective       other
  c_measure meanage quality     yi     vi
1     other   22.00       1 0.1892 0.0094
2       NEO   53.59       1 0.1634 0.0013
3       NEO   43.36       2 0.3541 0.0192
4     other   41.70       1 0.3316 0.0096
5       NEO   46.39       2 0.2769 0.0145
6       NEO   41.20       2 0.0000 0.0161
Visualization
# Funnel Plot
p <- as.ggplot(function(){
  funnel(x = res, main = "Funnel Plot (metafor)",
         level = c(90, 95, 99), shade = c("white","#a90e07","#d23e0b"), refline = 0)
  })

p