# Install packages
if (!requireNamespace("ggplot2", quietly = TRUE)) {
  install.packages("ggplot2")
}
if (!requireNamespace("ggthemes", quietly = TRUE)) {
  install.packages("ggthemes")
}

# Load packages
library(ggplot2)
library(ggthemes)Mirror Density & Histogram
Note
Hiplot website
This page is the tutorial for source code version of the Hiplot Mirror Density & Histogram plugin. You can also use the Hiplot website to achieve no code ploting. For more information please see the following link:
The mirror density & histogram is a graph used to observe the distribution of continuous variables in two side view: top and bottom.
Setup
System Requirements: Cross-platform (Linux/MacOS/Windows)
Programming language: R
Dependent packages:
ggplot2;ggthemes
Data Preparation
# Load data
data <- read.delim("files/Hiplot/038-density-hist-mirror-data.txt", header = T)

# convert data structure
sides <- data[1,]
data <- data[-1,]
for (i in 1:ncol(data)) {
  data[,i] <- as.numeric(data[,i])
}

# View data
head(data)
var1 var2 var3 var4 var5 var6
2 0.54659146 1.575592 1.508968 2.504824 5.540246 6.198931
3 -0.64052340 5.275076 1.498841 4.436792 4.987390 5.194154
4 1.03196438 2.561983 4.018349 3.506171 5.030395 6.570980
5 0.09518815 1.802874 2.057855 2.789252 4.797252 7.545844
6 0.89147721 2.627927 2.218567 4.581939 4.791792 5.468657
7 0.61786781 3.574565 2.051910 4.929031 5.830516 6.105716Visualization
1. Mirror Density
# Mirror Density
p <- ggplot(data, aes(x=x))
colrs <- c("#e64b35ff","#4dbbd5ff","#00a087ff","#3c5488ff","#f39b7fff","#8491b4ff")
colrs2 <- colnames(data)
for (i in seq_len(length(sides))) {
  eval(parse(
    text = sprintf("p <- p + geom_density(aes(x = %s, y = %s..density.., color = '%s', fill = '%s'), kernel = '%s')",
                   colnames(data)[i], ifelse(sides[i] == "top", "", "-"), colnames(data)[i],
                   colnames(data)[i], "gaussian")
    ))
  names(colrs)[i] <- colnames(data)[i]
  names(colrs2)[i] <- colrs[i]
}
p <- p +
  ggtitle("") +
  scale_fill_manual(values=colrs, name="Densities") +
  scale_color_manual(values=colrs, name="Densities") +
  theme_stata() +
  theme(text = element_text(family = "Arial"),
        plot.title = element_text(size = 12,hjust = 0.5),
        axis.title = element_text(size = 12),
        axis.text = element_text(size = 10),
        axis.text.x = element_text(angle = 0, hjust = 0.5,vjust = 1),
        legend.position = "right",
        legend.direction = "vertical",
        legend.title = element_text(size = 10),
        legend.text = element_text(size = 10))

p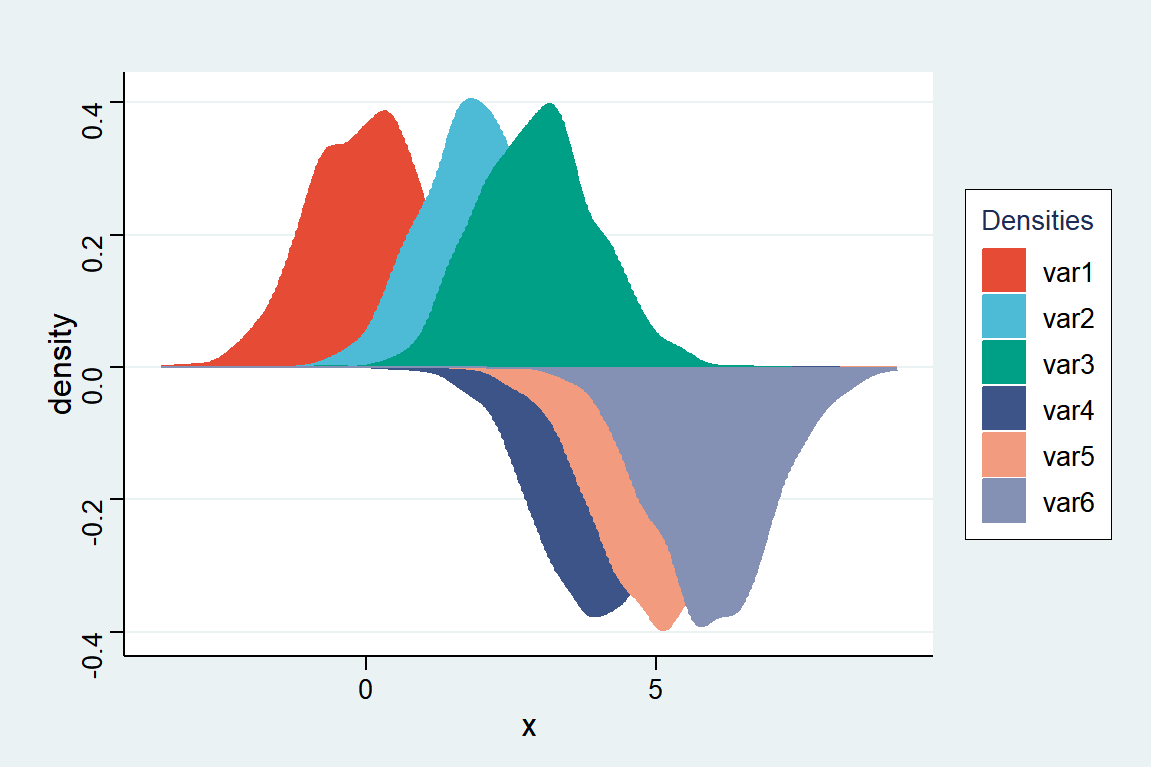
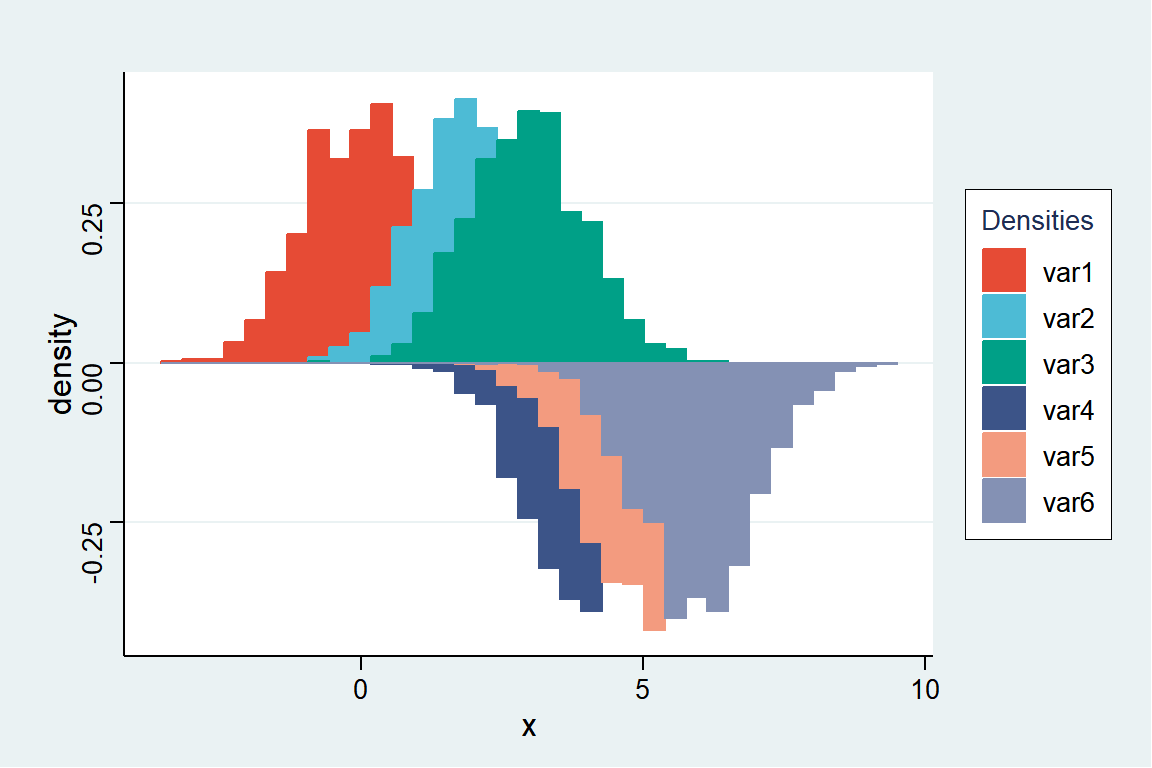
2. Mirror Histogram
# Mirror Histogram
p <- ggplot(data, aes(x=x))
colrs <- c("#e64b35ff","#4dbbd5ff","#00a087ff","#3c5488ff","#f39b7fff","#8491b4ff")
colrs2 <- colnames(data)
for (i in seq_len(length(sides))) {
  eval(parse(
    text = sprintf("p <- p + geom_histogram(aes(x = %s, y = %s..density.., color = '%s', fill = '%s'), bins = %s)",
                   colnames(data)[i], ifelse(sides[i] == "top", "", "-"),
                   colnames(data)[i], colnames(data)[i], 35)))
  names(colrs)[i] <- colnames(data)[i]
  names(colrs2)[i] <- colrs[i]
}
p <- p +
  ggtitle("") +
  scale_fill_manual(values=colrs, name="Densities") +
  scale_color_manual(values=colrs, name="Densities") +
  theme_stata() +
  theme(text = element_text(family = "Arial"),
        plot.title = element_text(size = 12,hjust = 0.5),
        axis.title = element_text(size = 12),
        axis.text = element_text(size = 10),
        axis.text.x = element_text(angle = 0, hjust = 0.5,vjust = 1),
        legend.position = "right",
        legend.direction = "vertical",
        legend.title = element_text(size = 10),
        legend.text = element_text(size = 10))

p