# Install packages
if (!requireNamespace("ggplot2", quietly = TRUE)) {
  install.packages("ggplot2")
}
if (!requireNamespace("ggalt", quietly = TRUE)) {
  install.packages("ggalt")
}

# Load packages
library(ggplot2)
library(ggalt)Group Dumbbell
Note
Hiplot website
This page is the tutorial for source code version of the Hiplot Group Dumbbell plugin. You can also use the Hiplot website to achieve no code ploting. For more information please see the following link:
Setup
System Requirements: Cross-platform (Linux/MacOS/Windows)
Programming language: R
Dependent packages:
ggplot2;ggalt
Data Preparation
# Load data
data <- read.delim("files/Hiplot/083-group-dumbbell-data.txt", header = T)
# Convert data structure
data <- data[order(data[["group"]], data[["y1952"]]),]
data[["country"]] <- factor(data[["country"]], levels = data[["country"]])
# View data
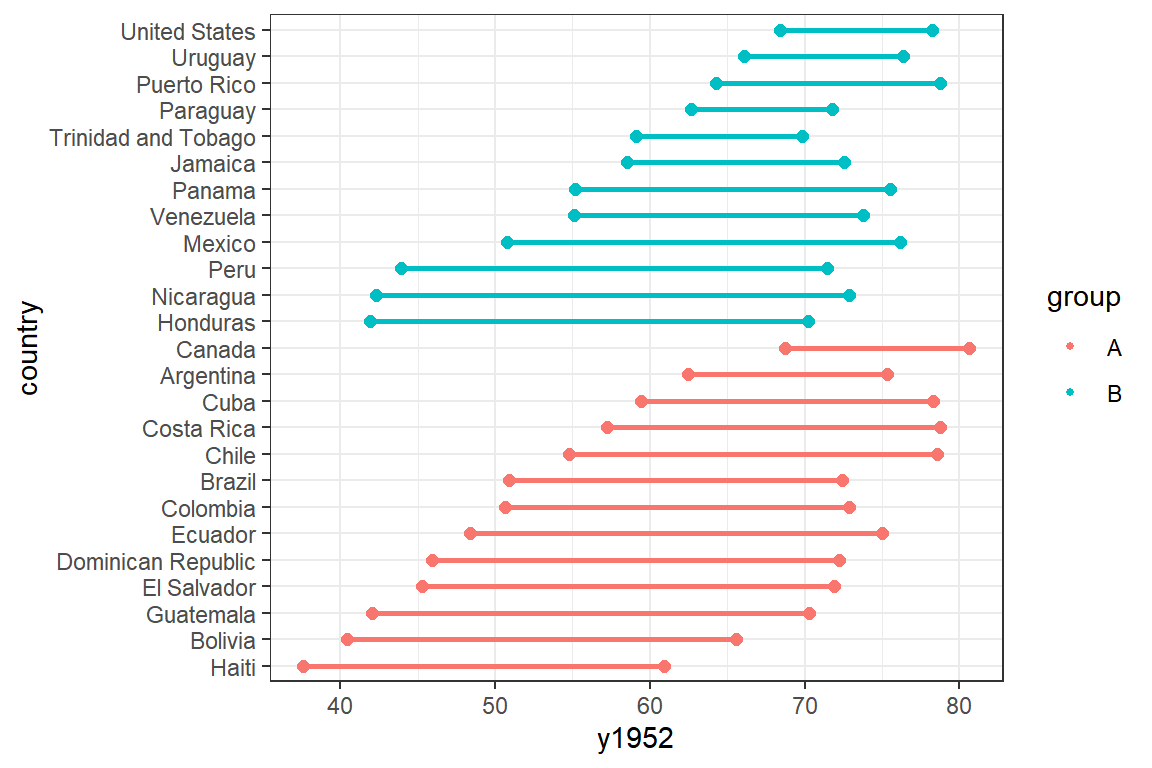
head(data) country y1952 y2007 group
13 Haiti 37.579 60.916 A
2 Bolivia 40.414 65.554 A
12 Guatemala 42.023 70.259 A
11 El Salvador 45.262 71.878 A
9 Dominican Republic 45.928 72.235 A
10 Ecuador 48.357 74.994 AVisualization
# Group Dumbbell
p <- ggplot(data = data, aes(x = y1952, xend = y2007, y = country, color = group)) +
  geom_dumbbell(size = 1, size_xend = 2, size_x = 2) +
  theme_bw()

p