# Install packages
if (!requireNamespace("ggplot2", quietly = TRUE)) {
  install.packages("ggplot2")
}
if (!requireNamespace("ggalt", quietly = TRUE)) {
  install.packages("ggalt")
}

# Load packages
library(ggplot2)
library(ggalt)Dumbbell Chart
Note
Hiplot website
This page is the tutorial for source code version of the Hiplot Dumbbell Chart plugin. You can also use the Hiplot website to achieve no code ploting. For more information please see the following link:
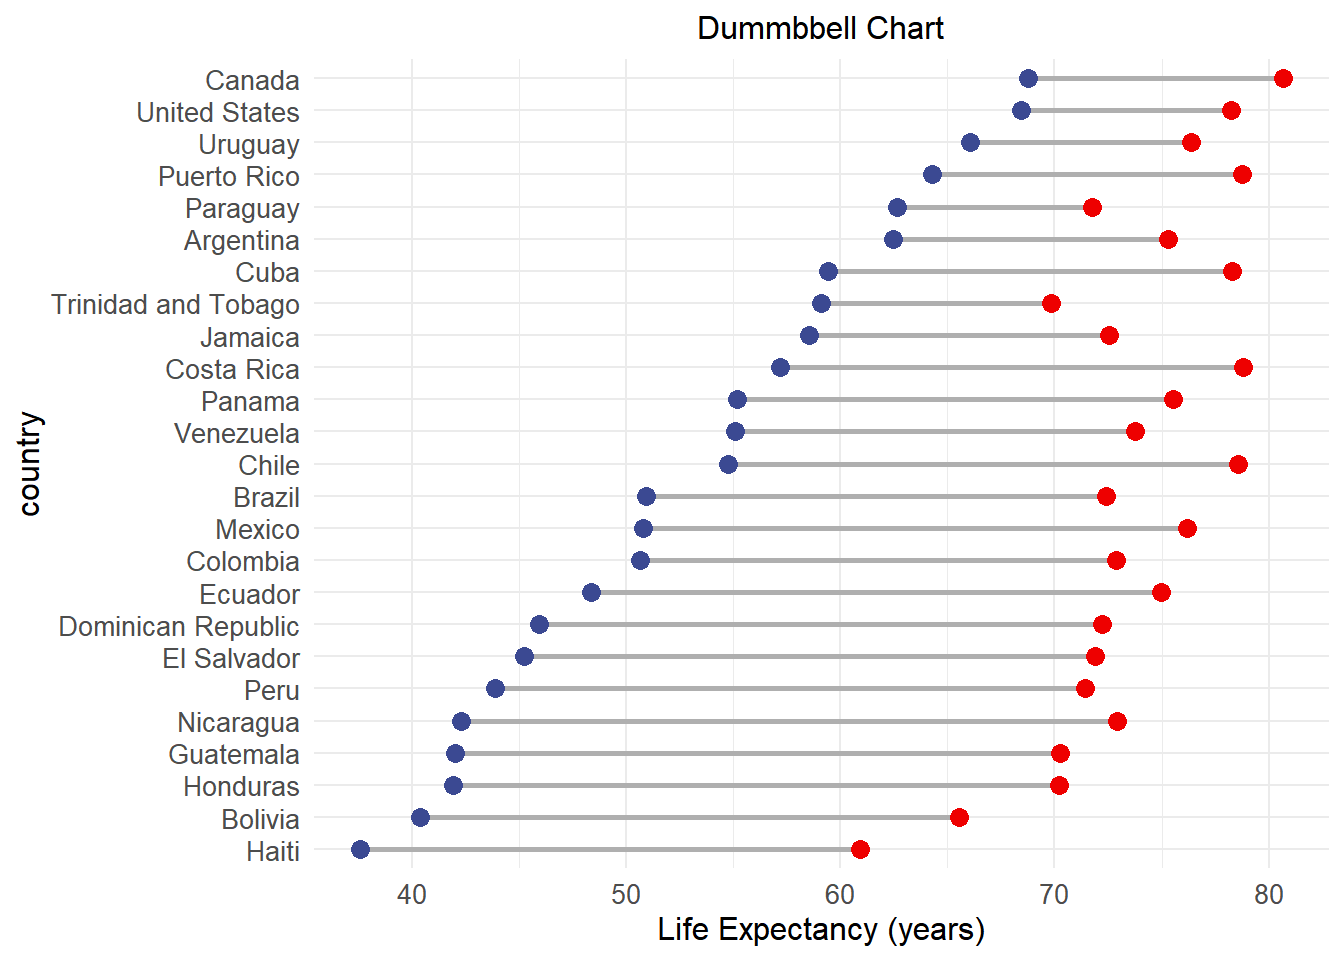
Dumbbell Chart can display the data change.
Setup
System Requirements: Cross-platform (Linux/MacOS/Windows)
Programming language: R
Dependent packages:
ggplot2;ggalt
Data Preparation
# Load data
data <- read.delim("files/Hiplot/048-dumbbell-data.txt", header = T)

# View data
head(data)
country y1952 y2007
1 Argentina 62.485 75.320
2 Bolivia 40.414 65.554
3 Brazil 50.917 72.390
4 Canada 68.750 80.653
5 Chile 54.745 78.553
6 Colombia 50.643 72.889Visualization
# Dumbbell Chart
colors <- c("#3B4992FF","#EE0000FF")
p <- ggplot(data, aes(y = reorder(country, y1952), x = y1952, xend = y2007)) +
  geom_dumbbell(size = 1, size_x = 3,  size_xend = 3, colour = "#AFAFAF",
                colour_x = colors[1],  colour_xend = colors[2]) +
  labs(title = "Dummbbell Chart", x = "Life Expectancy (years)",
       y = "country") +
  theme_minimal() +
  theme(text = element_text(family = "Arial"),
        plot.title = element_text(size = 12,hjust = 0.5),
        axis.title = element_text(size = 12),
        axis.text = element_text(size = 10),
        axis.text.x = element_text(angle = 0, hjust = 0.5,vjust = 1),
        legend.position = "right",
        legend.direction = "vertical",
        legend.title = element_text(size = 10),
        legend.text = element_text(size = 10))

p