# Install packages
if (!requireNamespace("GGally", quietly = TRUE)) {
  install.packages("GGally")
}

# Load packages
library(GGally)Easy Pairs
Note
Hiplot website
This page is the tutorial for source code version of the Hiplot Easy Pairs plugin. You can also use the Hiplot website to achieve no code ploting. For more information please see the following link:
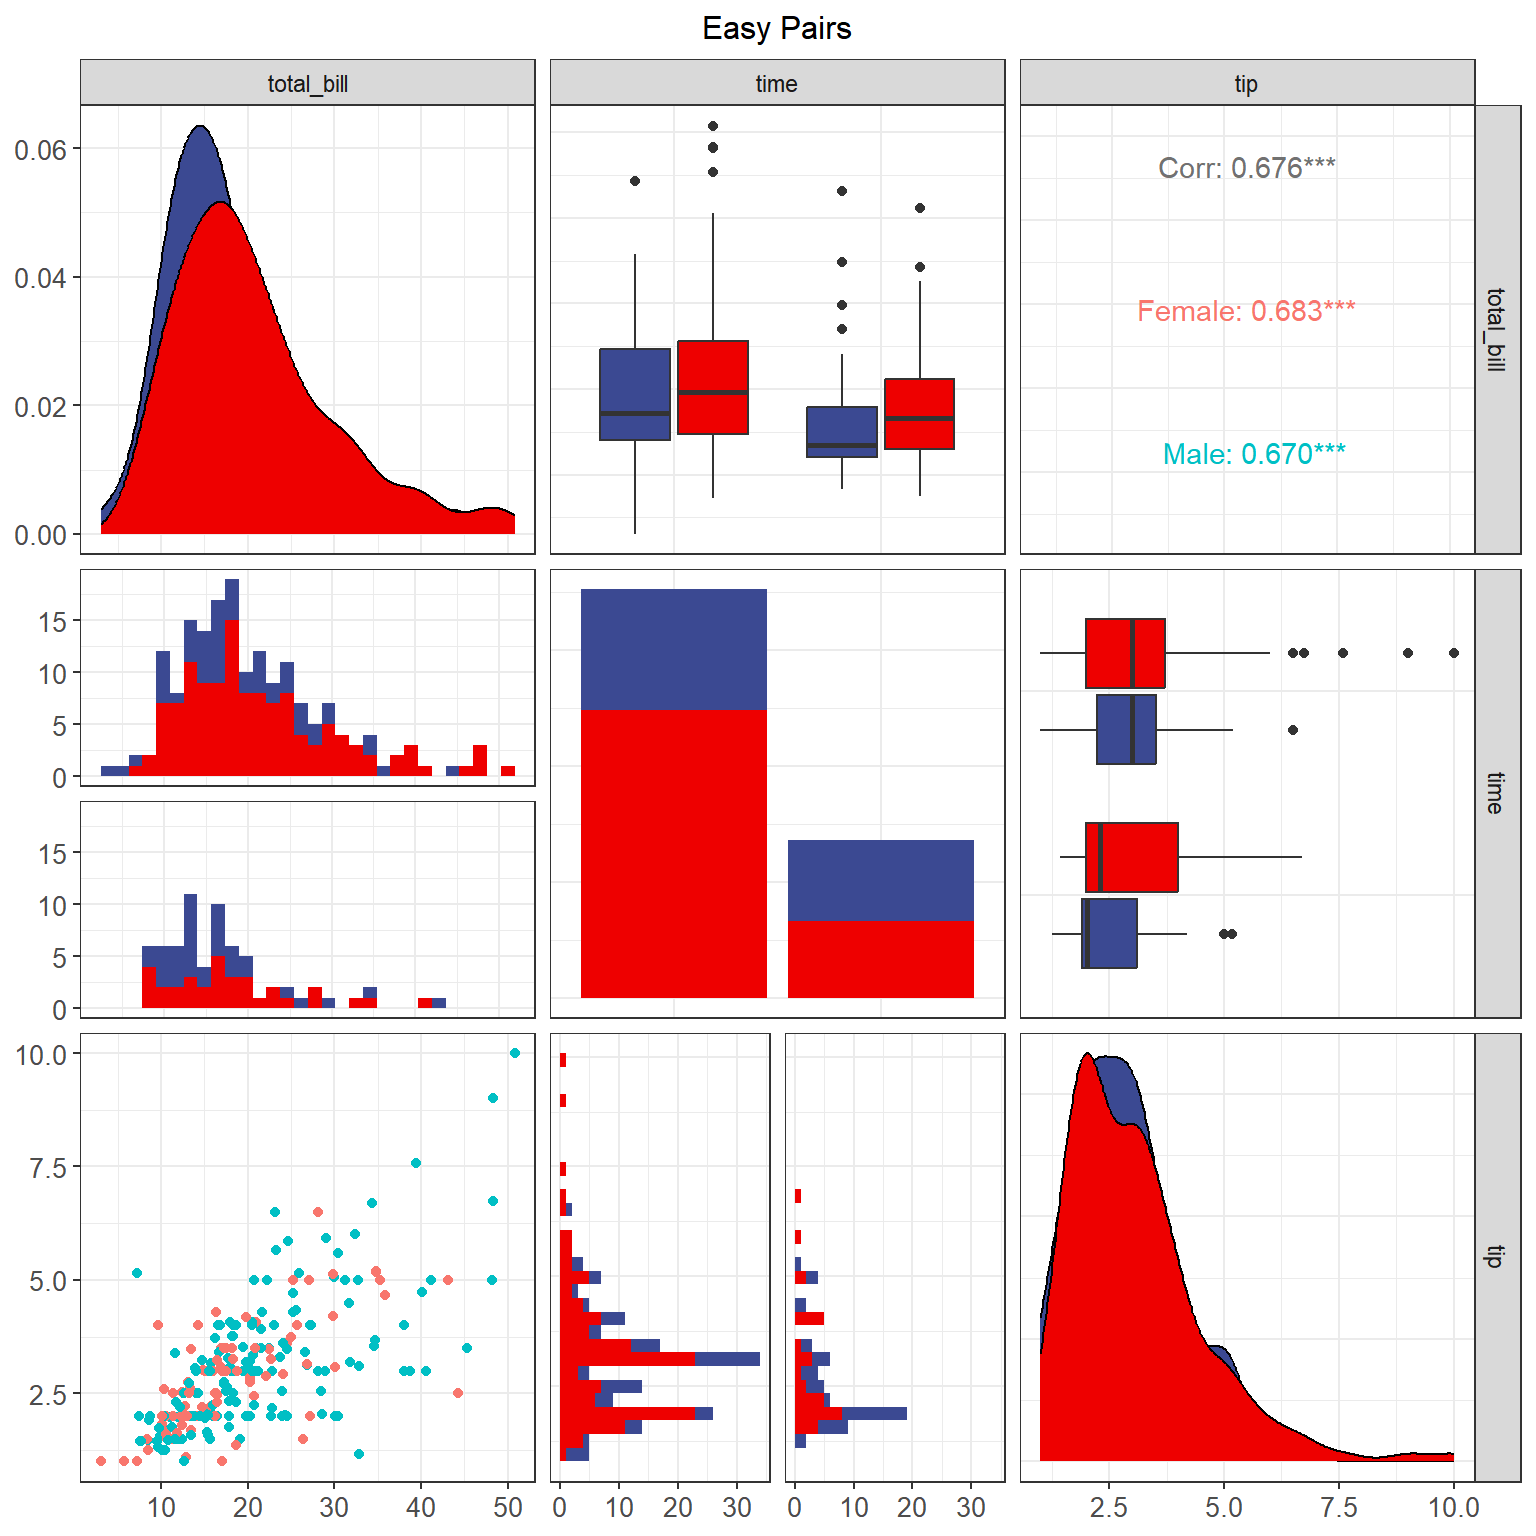
Display a matrix of plots for viewing correlation relationship and distributions of multiple variables.
Setup
System Requirements: Cross-platform (Linux/MacOS/Windows)
Programming language: R
Dependent packages:
GGally
Data Preparation
# Load data
data <- read.delim("files/Hiplot/049-easy-pairs-data.txt", header = T)

# View data
head(data)
total_bill tip gender smoker day time size
1 16.99 1.01 Female No Sun Dinner 2
2 10.34 1.66 Male No Sun Dinner 3
3 21.01 3.50 Male No Sun Dinner 3
4 23.68 3.31 Male No Sun Dinner 2
5 24.59 3.61 Female No Sun Dinner 4
6 25.29 4.71 Male No Sun Dinner 4Visualization
# Easy Pairs
p <- ggpairs(data, columns = c("total_bill", "time", "tip"),
             mapping = aes_string(color = "gender")) +
  ggtitle("Easy Pairs") +
  scale_fill_manual(values = c("#3B4992FF","#EE0000FF")) +
  theme_bw() +
  theme(text = element_text(family = "Arial"),
        plot.title = element_text(size = 12,hjust = 0.5),
        axis.title = element_text(size = 12),
        axis.text = element_text(size = 10),
        axis.text.x = element_text(angle = 0, hjust = 0.5,vjust = 1),
        legend.position = "right",
        legend.direction = "vertical",
        legend.title = element_text(size = 10),
        legend.text = element_text(size = 10))

p