# Install packages
if (!requireNamespace("FunnelPlotR", quietly = TRUE)) {
  install.packages("FunnelPlotR")
}
if (!requireNamespace("gridExtra", quietly = TRUE)) {
  install.packages("gridExtra")
}

# Load packages
library(FunnelPlotR)
library(gridExtra)Funnel Plot
Note
Hiplot website
This page is the tutorial for source code version of the Hiplot Funnel Plot plugin. You can also use the Hiplot website to achieve no code ploting. For more information please see the following link:
Can be used to show potential bias factors in Meta-analysis.
Setup
System Requirements: Cross-platform (Linux/MacOS/Windows)
Programming language: R
Dependent packages:
FunnelPlotR;gridExtra
Data Preparation
# Load data
data <- read.delim("files/Hiplot/058-funnel-plot-data.txt", header = T)

# View data
head(data)
los hmo white died age80 type type1 type2 type3 provnum prds
1 4 0 1 0 0 1 1 0 0 30001 9.667315
2 9 1 1 0 0 1 1 0 0 30001 8.956472
3 3 1 1 1 1 1 1 0 0 30001 6.856678
4 9 0 1 0 0 1 1 0 0 30001 9.667315
5 1 0 1 1 1 1 1 0 0 30001 7.400868
6 4 0 1 1 0 1 1 0 0 30001 7.561051Visualization
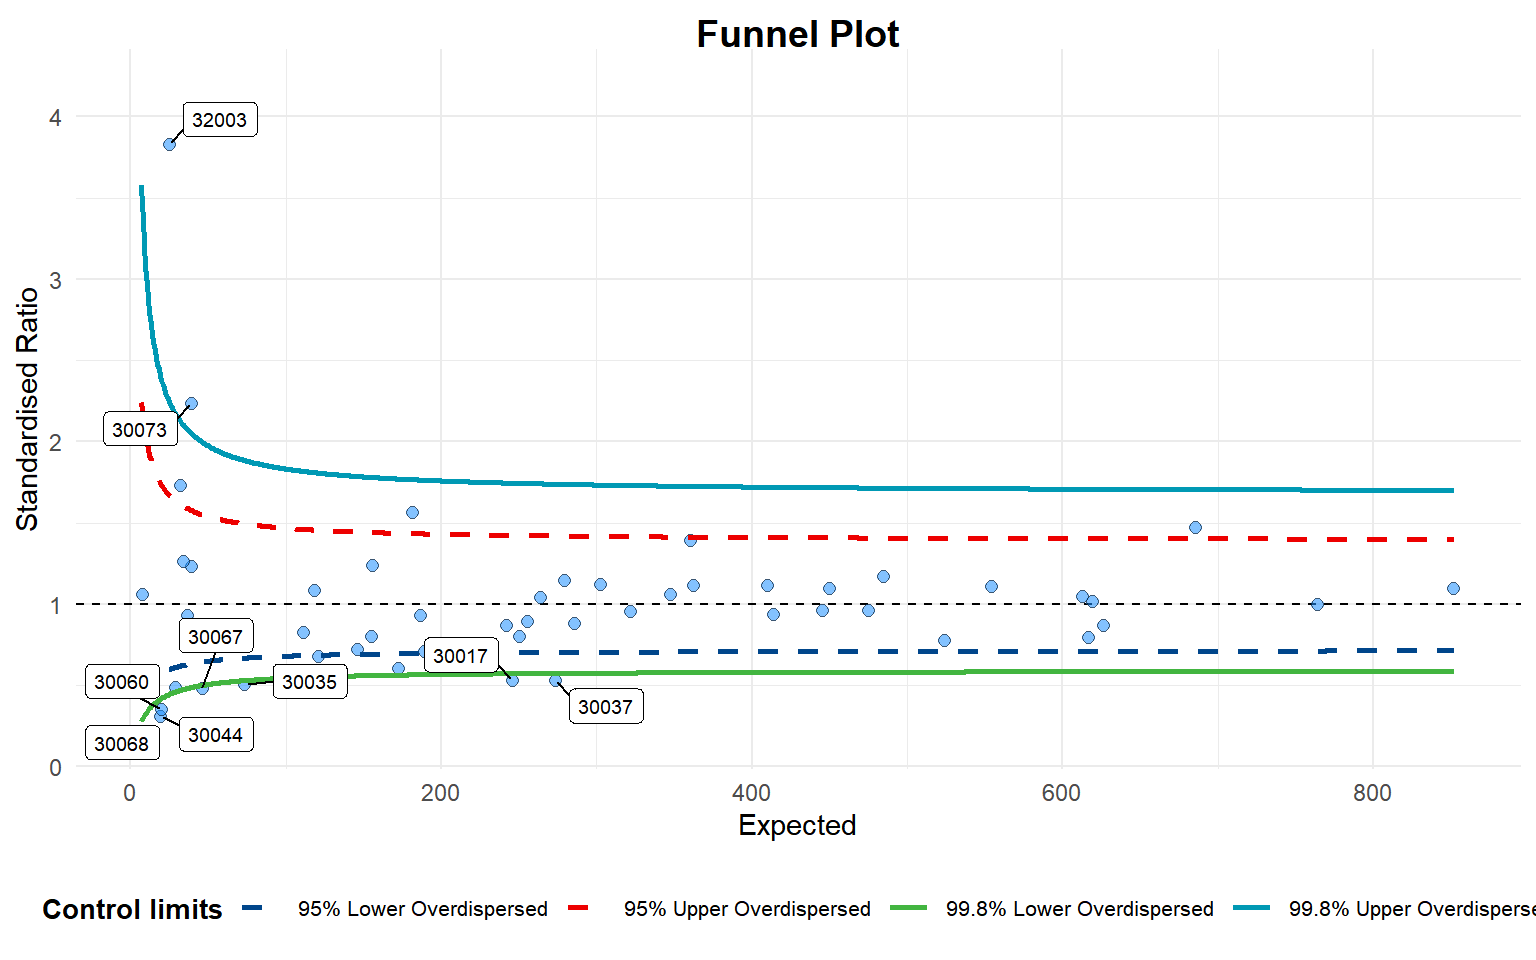
# Funnel Plot
plot_cols <- c("#925E9FFF","#FDAF91FF","#AD002AFF","#ADB6B6FF","#00468BFF","#ED0000FF","#42B540FF","#0099B4FF")
p <- funnel_plot(
  data, numerator = los, denominator = prds,  group = provnum, data_type = "SR",
  limit = 99, label = "outlier", sr_method = "SHMI", trim_by=0.1,
  title = "Funnel Plot", x_range = "auto", y_range = "auto",
  plot_cols=plot_cols
  )

p
A funnel plot object with 54 points of which 9 are outliers.
Plot is adjusted for overdispersion.