# Install packages
if (!requireNamespace("ggstatsplot", quietly = TRUE)) {
  install.packages("ggstatsplot")
}
if (!requireNamespace("ggplot2", quietly = TRUE)) {
  install.packages("ggplot2")
}
if (!requireNamespace("cowplot", quietly = TRUE)) {
  install.packages("cowplot")
}

# Load packages
library(ggstatsplot)
library(ggplot2)
library(cowplot)Barstats
Note
Hiplot website
This page is the tutorial for source code version of the Hiplot Barstats plugin. You can also use the Hiplot website to achieve no code ploting. For more information please see the following link:
Setup
System Requirements: Cross-platform (Linux/MacOS/Windows)
Programming language: R
Dependent packages:
ggstatsplot;ggplot2;cowplot
Data Preparation
# Load data
data <- read.delim("files/Hiplot/063-ggbarstats-data.txt", header = T)

# Convert data structure
axis <- c("relig", "partyid", "race")
data[, axis[1]] <- factor(data[, axis[1]], levels = rev(unique(data[, axis[1]])))
data[, axis[2]] <- factor(data[, axis[2]], levels = unique(data[, axis[2]]))
data[, axis[3]] <- factor(data[, axis[3]], levels = unique(data[, axis[3]]))

# View data
head(data)
year marital age race rincome partyid relig
1 2000 Never married 26 White $8000 to 9999 Ind,near rep Protestant
2 2000 Divorced 48 White $8000 to 9999 Not str republican Protestant
3 2000 Widowed 67 White Not applicable Independent Protestant
4 2000 Divorced 25 White Not applicable Not str democrat None
5 2000 Married 25 White $20000 - 24999 Strong democrat Protestant
6 2000 Divorced 44 White $7000 to 7999 Ind,near dem Protestant
denom tvhours
1 Southern baptist 12
2 Baptist-dk which NA
3 No denomination 2
4 Not applicable 1
5 Southern baptist NA
6 Lutheran-mo synod NAVisualization
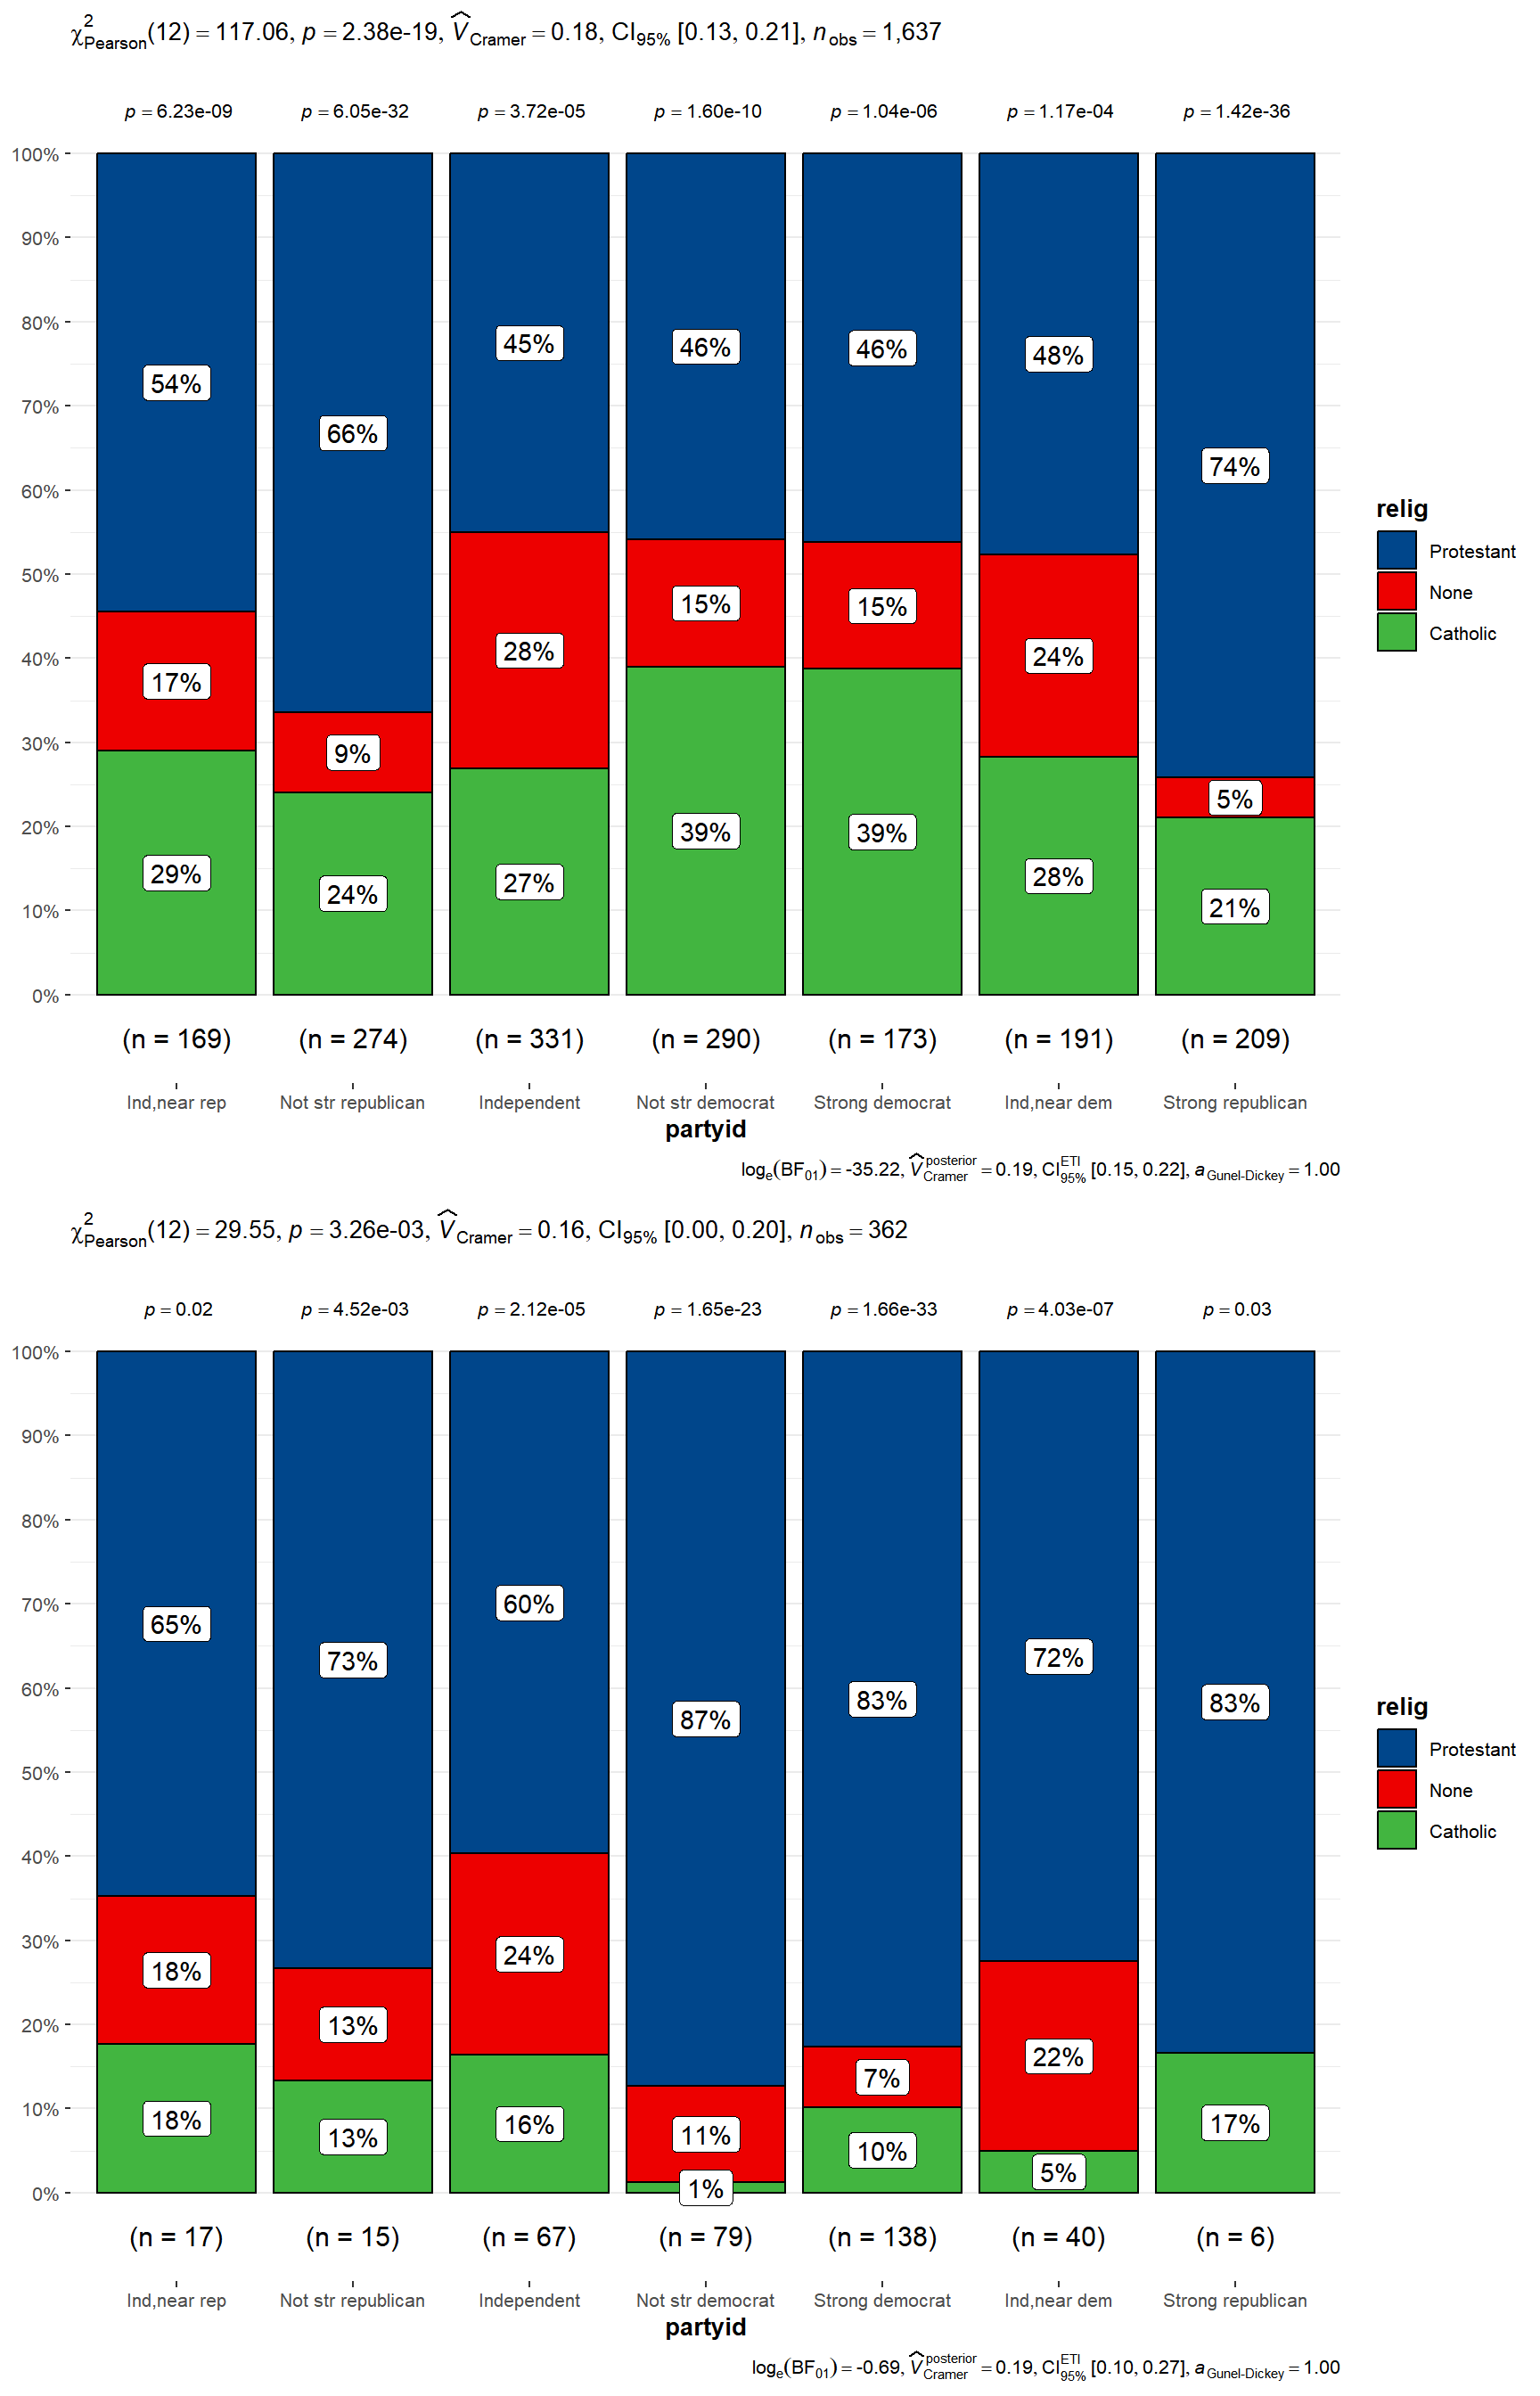
# Barstats
g <- unique(data[,axis[3]])
plist <- list()
for (i in 1:length(g)) {
  fil <- data[,axis[3]] == g[i]
  plist[[i]] <- ggbarstats(
    data = data[fil,], x = relig, y = partyid,
    plotgrid.args = list(ncol = 1), paired = F, k = 2) +
    scale_fill_manual(values = c("#00468BFF","#ED0000FF","#42B540FF"))
}
p <- plot_grid(plotlist = plist, ncol = 1)

p