# Install packages
if (!requireNamespace("ggstatsplot", quietly = TRUE)) {
  install.packages("ggstatsplot")
}
if (!requireNamespace("ggplot2", quietly = TRUE)) {
  install.packages("ggplot2")
}
if (!requireNamespace("cowplot", quietly = TRUE)) {
  install.packages("cowplot")
}

# Load packages
library(ggstatsplot)
library(ggplot2)
library(cowplot)Complex-Violin
Note
Hiplot website
This page is the tutorial for source code version of the Hiplot Complex-Violin plugin. You can also use the Hiplot website to achieve no code ploting. For more information please see the following link:
Setup
System Requirements: Cross-platform (Linux/MacOS/Windows)
Programming language: R
Dependent packages:
ggstatsplot;ggplot2;cowplot
Data Preparation
# Load data
data <- read.delim("files/Hiplot/075-ggwithinstats-data.txt", header = T)

# Convert data structure
axis <- c("condition", "desire", "region")
data[, axis[1]] <- factor(data[, axis[1]], levels = unique(data[, axis[1]]))
data[, axis[3]] <- factor(data[, axis[3]], levels = unique(data[, axis[3]]))

# View data
str(data)
'data.frame': 172 obs. of 6 variables:
$ subject : int 1 2 3 4 5 6 7 8 9 11 ...
$ gender : chr "Female" "Female" "Female" "Female" ...
$ region : Factor w/ 2 levels "North America",..: 1 1 2 1 1 2 1 1 1 1 ...
$ education: chr "some" "advance" "college" "college" ...
$ condition: Factor w/ 2 levels "LDLF","LDHF": 1 1 1 1 1 1 1 1 1 1 ...
$ desire : num 6 10 5 6 3 2 10 10 9.5 0 ...Visualization
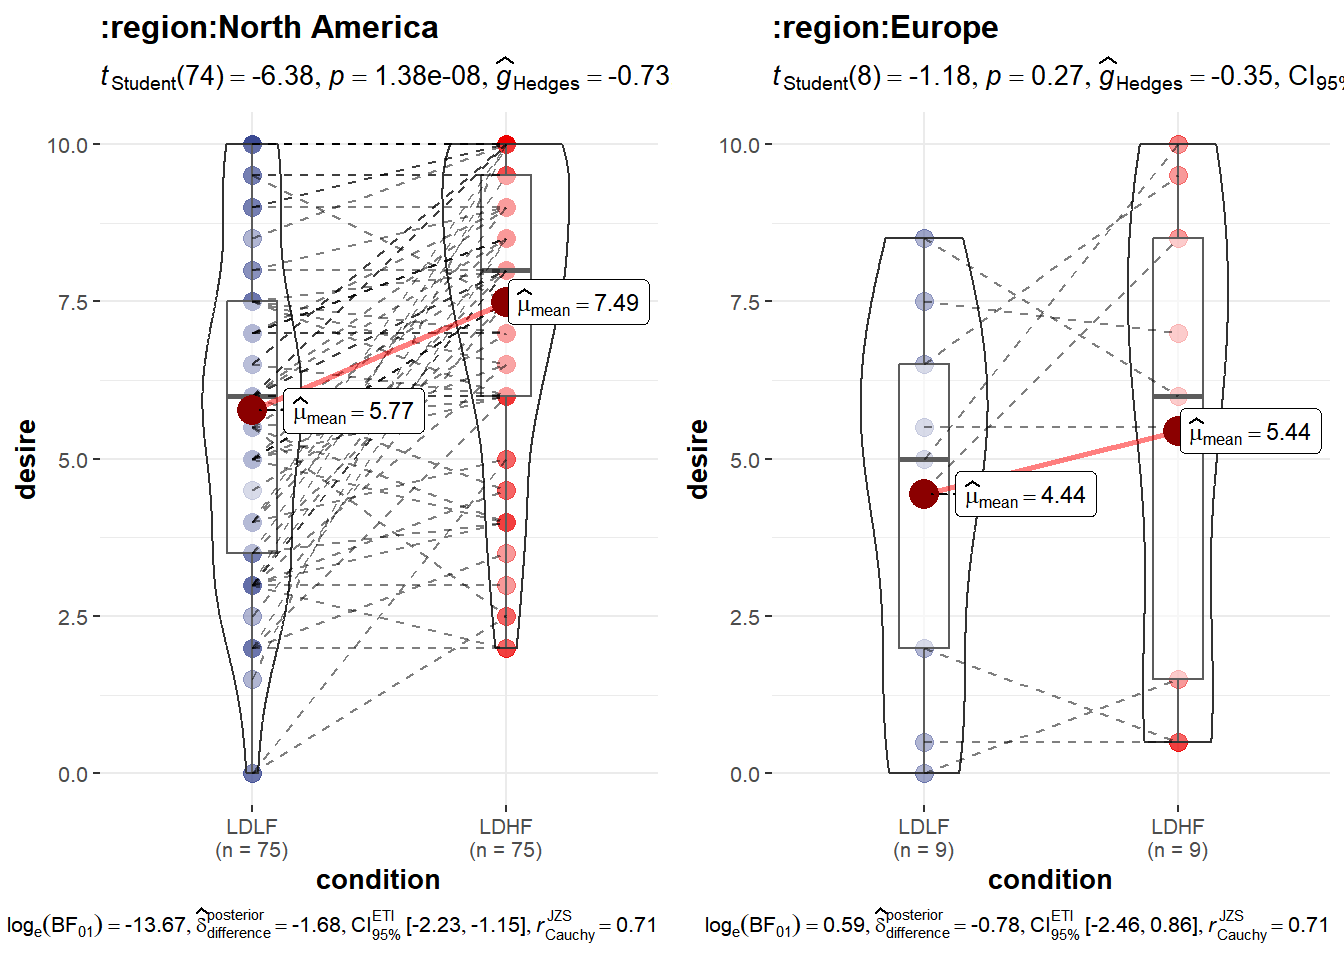
# Complex-Violin
g <- unique(data[,axis[3]])
plist <- list()
for (i in 1:length(g)) {
  fil <- data[,axis[3]] == g[i]
  plist[[i]] <- ggwithinstats(
    data = data[fil,], x = condition, y = desire,
    title= paste('', axis[3], g[i], sep = ':'),
    p.adjust.method = "holm",
    plot.type = "boxviolin",
    pairwise.comparisons = T,
    pairwise.display = "significant",
    effsize.type = "unbiased",
    notch = T,
    type = "parametric",
    k = 2,
    plotgrid.args = list(ncol = 2)
  ) +
    scale_color_manual(values = c("#3B4992FF","#EE0000FF"))
}

plot_grid(plotlist = plist, ncol = 2)