# Install packages
if (!requireNamespace("fishplot", quietly = TRUE)) {
  install_github("dongwei1220/flowerplot")
}
if (!requireNamespace("ggplotify", quietly = TRUE)) {
  install.packages("ggplotify")
}

# Load packages
library(flowerplot)
library(ggplotify)Flower plot
Note
Hiplot website
This page is the tutorial for source code version of the Hiplot Flower plot plugin. You can also use the Hiplot website to achieve no code ploting. For more information please see the following link:
Flower plot with multiple sets.
Setup
System Requirements: Cross-platform (Linux/MacOS/Windows)
Programming language: R
Dependent packages:
flowerplot;ggplotify
Data Preparation
# Load data
data <- read.delim("files/Hiplot/056-flowerplot-data.txt", header = T)
# View data
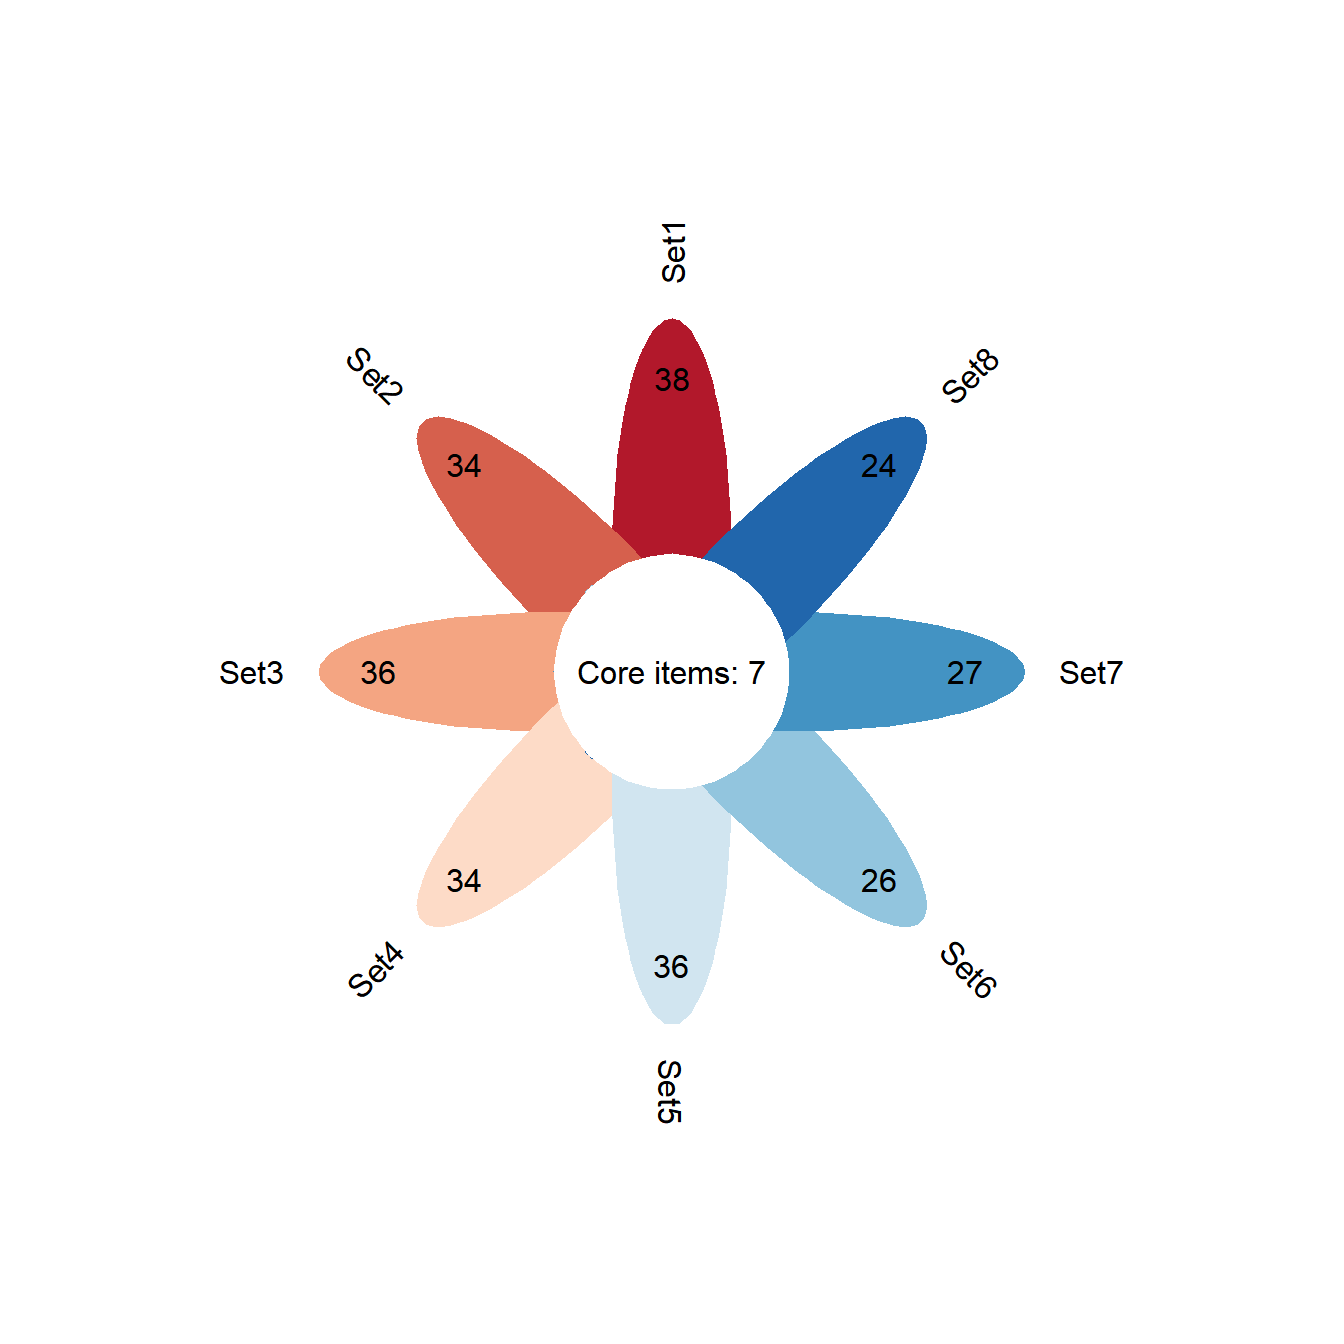
head(data) Set1 Set2 Set3 Set4 Set5 Set6 Set7 Set8
1 ZMIZ1 ADCY5 TNS1 TNS1 TNS1 ZMIZ1 SORBS1 RGS3
2 TNS1 ACTN4 ZMIZ1 ZMIZ1 ZMIZ1 TNS1 TNS1 FHOD3
3 CASZ1 SORBS1 RXRA RXRA TSPAN9 CASZ1 ZMIZ1 PPARGC1B
4 NFIC TNS1 AHDC1 NCOR2 MIDN NFIC RBM20 NNMT
5 CACNA1C ZMIZ1 ACTN4 MIDN NCOR2 CACNA1C TSPAN9 SORBS2
6 AHDC1 RBM20 MIDN AHDC1 AHDC1 AHDC1 SYNPO FAM53BVisualization
# Flower plot
p <- as.ggplot(function(){
  flowerplot(
    flower_dat = data,
    angle = 90,
    a = 0.5,
    b = 2,
    r = 1,
    ellipse_col = "RdBu",
    circle_col = "#FFFFFF",
    label_text_cex = 1
  )})

p