# 安装包
if (!requireNamespace("gggibbous", quietly = TRUE)) {
  install.packages("gggibbous")
}
if (!requireNamespace("ggplot2", quietly = TRUE)) {
  install.packages("ggplot2")
}

# 加载包
library(gggibbous)
library(ggplot2)月亮饼图
注记
Hiplot 网站
本页面为 Hiplot Moon charts 插件的源码版本教程,您也可以使用 Hiplot 网站实现无代码绘图,更多信息请查看以下链接:
月亮图是一种使用月亮的盈缺来反应数据大小的图形。
环境配置
系统: Cross-platform (Linux/MacOS/Windows)
编程语言: R
依赖包:
gggibbous;ggplot2
数据准备
载入数据为餐厅名称及各种餐厅内食物种类数,装饰风格种类数,成套餐具种类数和价格种类数。
# 加载数据
data <- read.delim("files/Hiplot/122-moon-charts-data.txt", header = T)

# 整理数据格式
data[, 1] <- factor(data[, 1], levels = unique(data[, 1]))
rest_cols <- colnames(data)[-1]
tidyrest <- reshape(
  data,
  varying = rest_cols,
  v.names = "Score",
  timevar = "Category",
  times = factor(rest_cols, levels = rest_cols),
  idvar = colnames(data)[1],
  direction = "long"
)

# 查看数据
head(data)
Restaurant
1 Anscombes Luncheonette\t5\t2\t4\t4\nChai Squared\t3\t5\t2\t5\nTukeys Honest Southern Diner
2 Bagels ANOVA
3 Spearmint Row
Food Decor Service Price
1 4 3 3 2
2 4 1 3 5
3 1 5 5 2可视化
# 月亮饼图
p <- ggplot(tidyrest, aes(0, 0)) +
  geom_moon(aes(ratio = (Score - 1) / 4), fill = "black") +
  geom_moon(aes(ratio = 1 - (Score - 1) / 4), right = FALSE) +
  facet_grid(Category ~ Restaurant, switch = "y") +
  theme_minimal() +
  theme(
    panel.grid = element_blank(),
    axis.text = element_blank(),
    axis.title = element_blank()
  )

p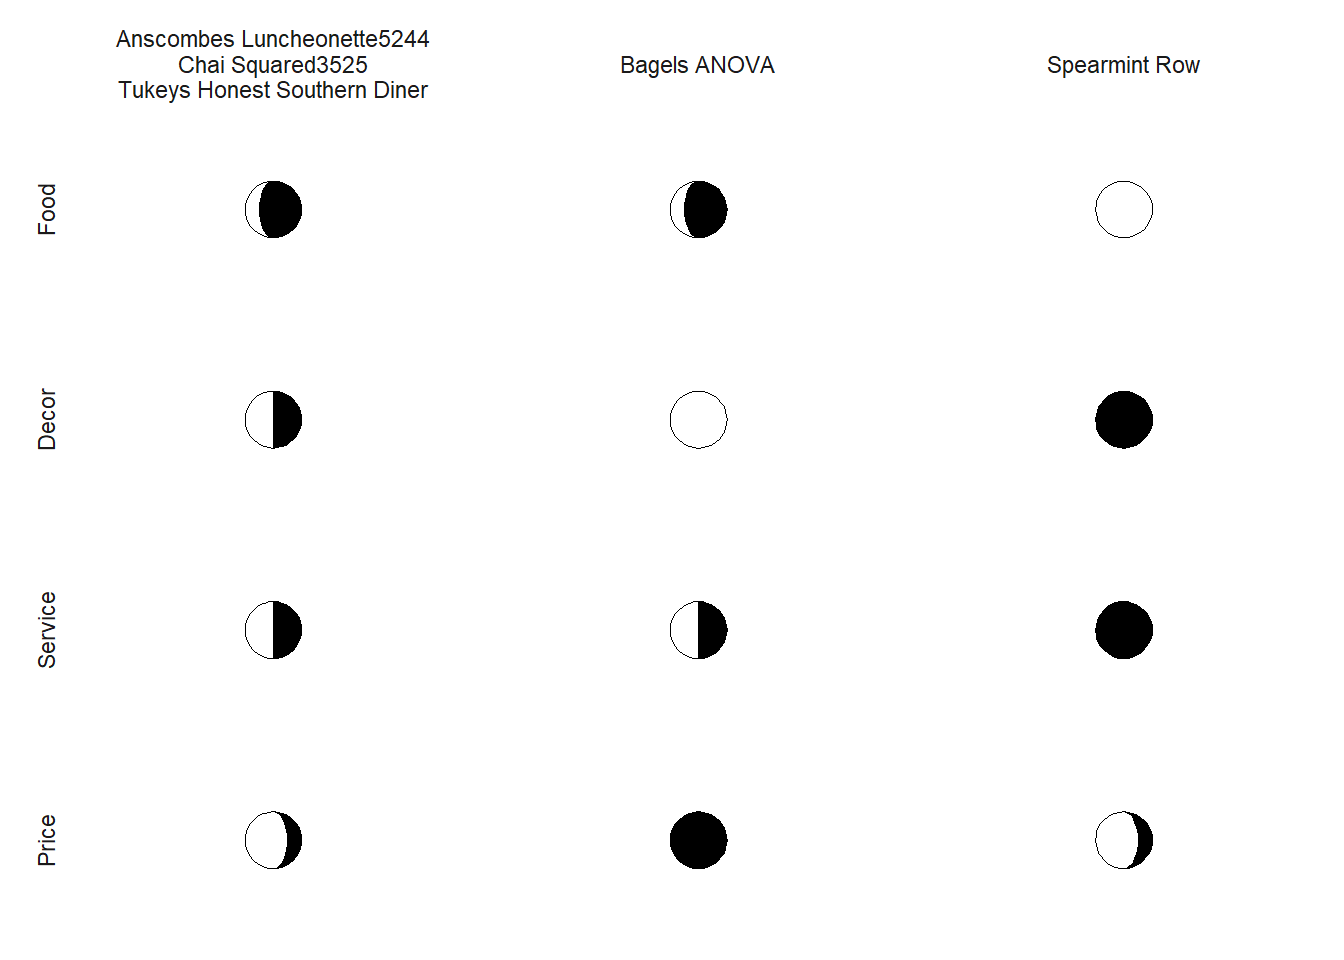
图示第一行表示餐厅名称,第一列表示餐厅内不同变量,空白月亮表示数目为 1(数目最少),黑色月亮表示数目为 5(数目最多)的数据,随着数据的增多月亮黑色区域逐渐变大,即逐渐变为满月。