# 安装包
if (!requireNamespace("igraph", quietly = TRUE)) {
  install.packages("igraph")
}
if (!requireNamespace("stringr", quietly = TRUE)) {
  install.packages("stringr")
}
if (!requireNamespace("ggplotify", quietly = TRUE)) {
  install.packages("ggplotify")
}
if (!requireNamespace("RColorBrewer", quietly = TRUE)) {
  install.packages("RColorBrewer")
}

# 加载包
library(igraph)
library(stringr)
library(ggplotify)
library(RColorBrewer)网路图 (igraph)
注记
Hiplot 网站
本页面为 Hiplot Network (igraph) 插件的源码版本教程,您也可以使用 Hiplot 网站实现无代码绘图,更多信息请查看以下链接:
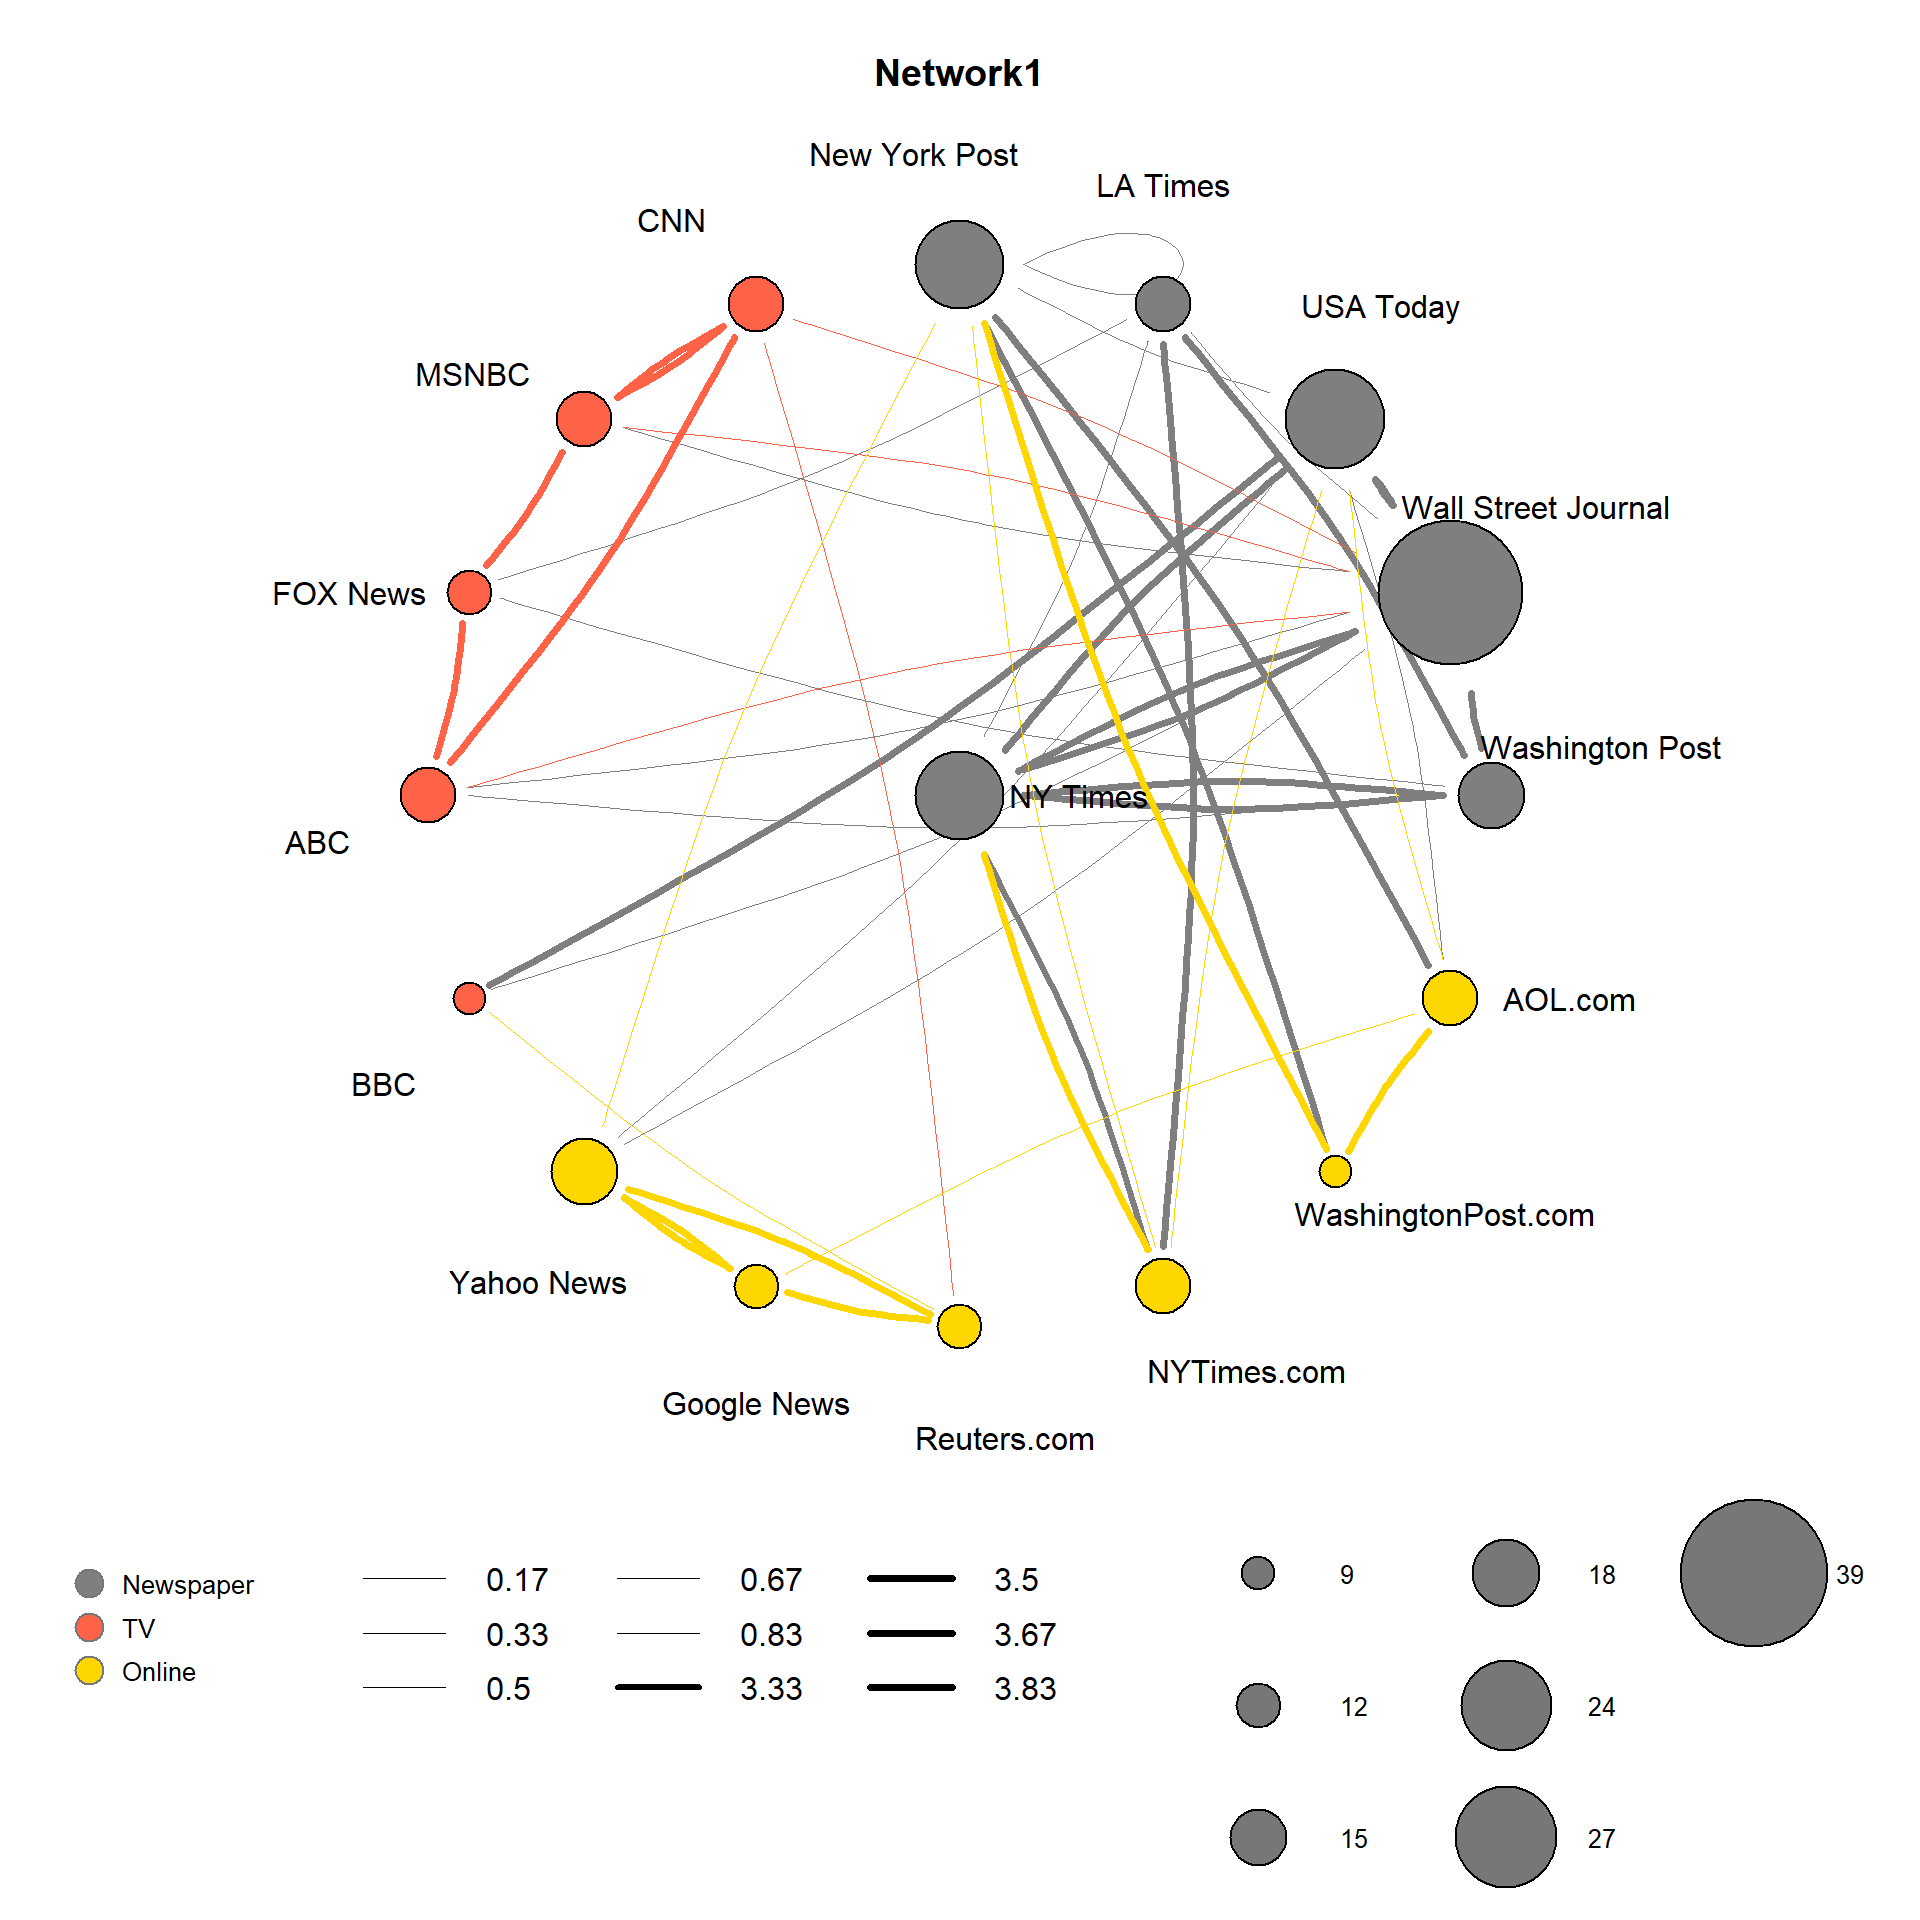
基于 igrpah 可视化基础网路图。
环境配置
系统: Cross-platform (Linux/MacOS/Windows)
编程语言: R
依赖包:
igraph;stringr;ggplotify;RColorBrewer
数据准备
需要输入两个数据表,表 1 为节点信息,包含节点的 ID 和 其余注释信息(用于映射颜色和大小),表 2 为连线信息,包含节点的 ID 以及节点之间的关联信息(用于连接不同节点,并映射连线的宽度信息)。
# 加载数据
nodes_data <- read.delim("files/Hiplot/127-network-igraph-data1.txt", header = T)
edges_data <- read.delim("files/Hiplot/127-network-igraph-data2.txt", header = T)

# 整理数据格式
nodes_data[,"type.label"] <- factor(nodes_data[,"type.label"],
                                    levels = unique(nodes_data[,"type.label"]))
nodes_data$hiplot_color_type <- as.numeric(nodes_data[,"type.label"])
net <- graph_from_data_frame(d = edges_data, vertices = nodes_data, directed = T)
## 根据类型生成颜色
colrs <- c("#7f7f7f","#ff6347","#ffd700")
colrs2 <- c("#BC3C29FF","#0072B5FF","#E18727FF","#20854EFF","#7876B1FF",
            "#6F99ADFF","#FFDC91FF","#EE4C97FF")
V(net)$color <- colrs[V(net)$hiplot_color_type]
## 计算节点度(#links)并使用它来设置节点大小
deg <- degree(net, mode="all")
V(net)$size <- deg*3
## 设置标签
V(net)$label.color <- "black"
V(net)$label <- NA
## 根据权重设置边宽度
weight_column <- edges_data$weight
E(net)$width <- weight_column/6
## 改变箭头大小和边颜色
E(net)$arrow.size <- .2
E(net)$edge.color <- "gray80"
edge.start <- ends(net, es=E(net), names=F)[,1]
edge.col <- V(net)$color[edge.start]

# 查看数据
head(nodes_data)
id media media.type type.label audience.size hiplot_color_type
1 s01 NY Times 1 Newspaper 20 1
2 s02 Washington Post 1 Newspaper 25 1
3 s03 Wall Street Journal 1 Newspaper 30 1
4 s04 USA Today 1 Newspaper 32 1
5 s05 LA Times 1 Newspaper 20 1
6 s06 New York Post 1 Newspaper 50 1head(edges_data) from to type weight
1 s01 s02 hyperlink 22
2 s01 s03 hyperlink 22
3 s01 s04 hyperlink 21
4 s01 s15 mention 20
5 s02 s01 hyperlink 23
6 s02 s03 hyperlink 21可视化
# 网路图 (igraph)
raw <- par()
p <- as.ggplot(function () {
  par(mar=c(8,2,2,2))
  radian.rescale <- function(x, start=0, direction=1) {
    c.rotate <- function(x) (x + start) %% (4 * pi) * direction
    c.rotate(scales::rescale(x, c(0, 2 * pi), range(x)))
  }

  label <- eval(parse(text = sprintf("V(net)$%s", "media")))

  l <- do.call(layout_as_star, list(net))
  params <- list(net, layout = l, main = "Network1",
      edge.color = edge.col, edge.curved = .1,
      vertex.shape = "circle",
      edge.lty = "solid",
      label.family = "Arial",
      vertex.label.family = "Arial",
      vertex.label.dist = 3.1,
      edge.arrow.mode = F
  )
  lab.locs <- radian.rescale(x=1:length(label), direction=-1, start=0)
  params$vertex.label.degree <- lab.locs
  params$vertex.label <- label
  params$vertex.color = V(net)$color
  do.call(plot, params)
  legend(x = -1.7, y = -1.4, unique(nodes_data[,"type.label"]), pch = 21,
        col = "#777777", pt.bg = colrs, pt.cex = 2, cex = .8, bty = "n",
        ncol = 1)
  legend(x = -1.2, y = -1.37,
    legend=round(sort(unique(E(net)$width)), 2), pt.cex= 0.8,
      col='black', ncol = 3, bty = "n", lty = 1,
      lwd = round(sort(unique(E(net)$width)), 2)
  )
  if (length(unique(V(net)$size)) > 8) {
    size_leg <- sort(unique(V(net)$size))[seq(1, length(unique(V(net)$size)), 2)]
  } else {
    size_leg <- sort(unique(V(net)$size))
  }
  legend(x = 0.5, y = -1.3,
        size_leg,
        pch = 21,
        col = "black", pt.bg = "#777777",
        pt.cex = size_leg / 3.8, cex = .8, bty = "n",
        ncol = 3,
        y.intersp = 3,
        x.intersp = 2.5,
        text.width = 0.25
  )
  par(mar=raw$mar)
})

p