# 安装包
if (!requireNamespace("GGally", quietly = TRUE)) {
  install.packages("GGally")
}
if (!requireNamespace("hrbrthemes", quietly = TRUE)) {
  install.packages("hrbrthemes")
}
if (!requireNamespace("viridis", quietly = TRUE)) {
  install.packages("viridis")
}
if (!requireNamespace("ggthemes", quietly = TRUE)) {
  install.packages("ggthemes")
}

# 加载包
library(GGally)
library(hrbrthemes)
library(viridis)
library(ggthemes)平行坐标图
注记
Hiplot 网站
本页面为 Hiplot Parallel Coordinate 插件的源码版本教程,您也可以使用 Hiplot 网站实现无代码绘图,更多信息请查看以下链接:
环境配置
系统: Cross-platform (Linux/MacOS/Windows)
编程语言: R
依赖包:
GGally;hrbrthemes;viridis;ggthemes
数据准备
# 加载数据
data <- read.delim("files/Hiplot/132-parallel-coordinate-data.txt", header = T)
# 整理数据格式
data[, 6] <- factor(data[, 6], levels = unique(data[, 6]))
# 查看数据
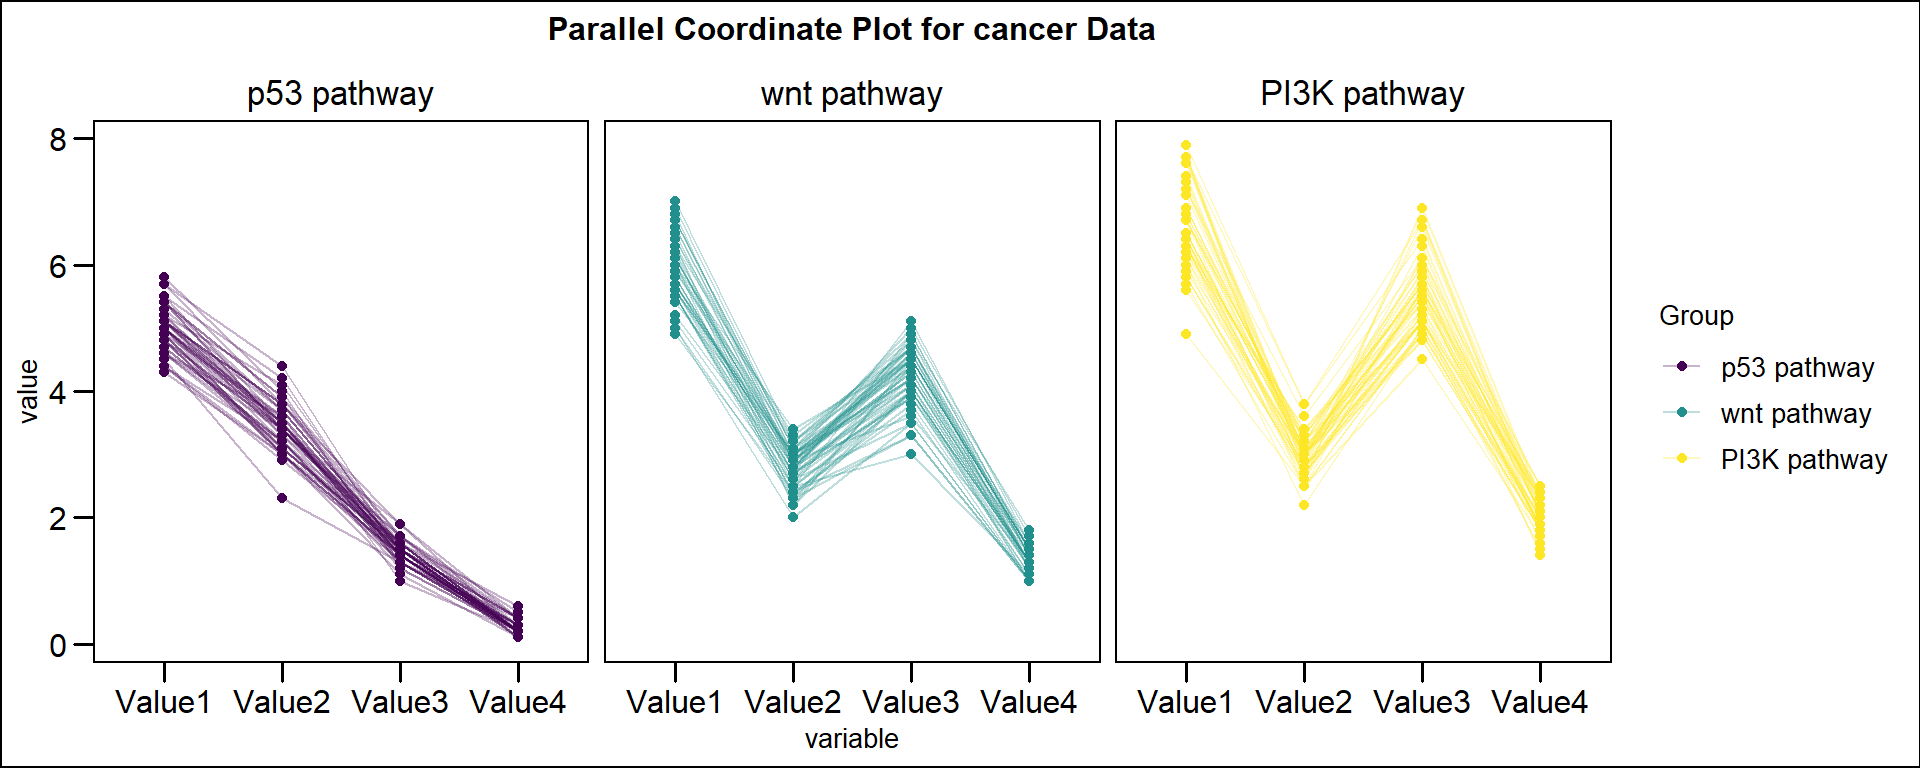
head(data) Name Value1 Value2 Value3 Value4 Group
1 ATR 5.1 3.5 1.4 0.2 p53 pathway
2 CHEK1 4.9 3.0 1.4 0.2 p53 pathway
3 GORAB 4.7 3.2 1.3 0.2 p53 pathway
4 CDKN2A 4.6 3.1 1.5 0.2 p53 pathway
5 MDM2 5.0 3.6 1.4 0.2 p53 pathway
6 MDM4 5.4 3.9 1.7 0.4 p53 pathway可视化
# 平行坐标图
p <- ggparcoord(data, columns = 2:(ncol(data) - 1), groupColumn = ncol(data),
                title = "Parallel Coordinate Plot for cancer Data",
                alphaLines = 0.3, scale = "globalminmax",
                showPoints = T, boxplot = F) +
  theme_base() +
  theme(text = element_text(family = "Arial"),
        plot.title = element_text(size = 12, hjust = 0.5),
        axis.title = element_text(size = 10),
        axis.text = element_text(size = 12),
        axis.text.x = element_text(angle = 0, hjust = 0.5,vjust = 1),
        legend.position = "right",
        legend.direction = "vertical",
        legend.title = element_text(size = 10),
        legend.text = element_text(size = 10)) +
  scale_color_viridis(discrete = TRUE) +
  facet_grid(formula(paste("~", (colnames(data)[ncol(data)]))))

p