# 安装包
if (!requireNamespace("VennDiagram", quietly = TRUE)) {
  install.packages("VennDiagram")
}
if (!requireNamespace("ComplexHeatmap", quietly = TRUE)) {
  install_github("jokergoo/ComplexHeatmap")
}
if (!requireNamespace("ggplotify", quietly = TRUE)) {
  install.packages("ggplotify")
}
if (!requireNamespace("ggplot2", quietly = TRUE)) {
  install.packages("ggplot2")
}

# 加载包
library(VennDiagram)
library(ComplexHeatmap)
library(ggplotify)
library(ggplot2)Upset 图
注记
Hiplot 网站
本页面为 Hiplot Upset Plot 插件的源码版本教程,您也可以使用 Hiplot 网站实现无代码绘图,更多信息请查看以下链接:
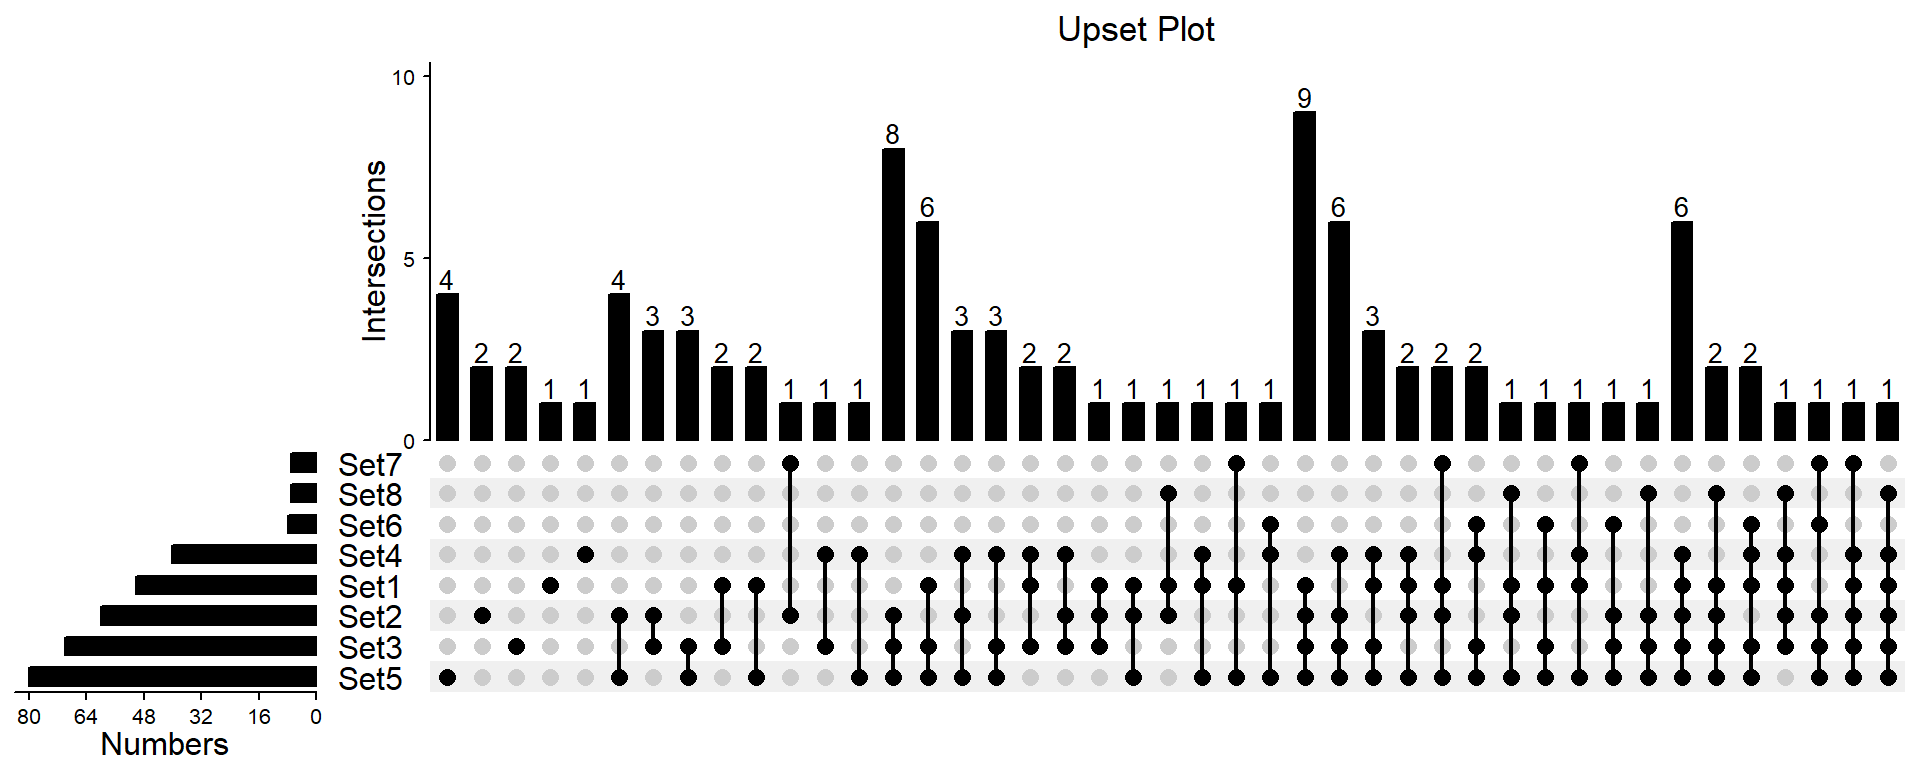
Upset 可用于展示集合之间的交互关系。
环境配置
系统: Cross-platform (Linux/MacOS/Windows)
编程语言: R
依赖包:
VennDiagram;ComplexHeatmap;ggplotify;ggplot2
数据准备
数据表可输入两种类型:list 和 binary。其中 list 格式为每列为一个集合,并包含所有集合对应的元素。binary 格式第一列为全部集合的全部元素,后续列为 0 和 1 组成的数值矩阵,1 则表明对应行元素存在于某个集合,0 则表示不存在。
# 加载数据
data <- read.delim("files/Hiplot/177-upset-plot-data.txt", header = T)

# 整理数据格式
for (i in seq_len(ncol(data))) {
  data[is.na(data[, i]), i] <- ""
}
data2 <- as.list(data)
data2 <- lapply(data2, function(x) {x[x != ""]})
data2 <- list_to_matrix(data2)
m = make_comb_mat(data2, mode = "distinct")
ss = set_size(m)
cs = comb_size(m)
set_order <- order(ss)
comb_order <- order(comb_degree(m), -cs)

# 查看数据
head(data)
Set1 Set2 Set3 Set4 Set5 Set6 Set7 Set8
1 ISG15 HES5 DVL1 MATP6P1 FAM132A FAM132A FAM132A TNFRSF4
2 TTLL10 AURKAIP1 ARHGEF16 MIR551A AGRN MIR551A WBP1LP6 WASH7P
3 HES4 LINC00982 OR4F16 C1orf222 WBP1LP6 MIR200B PANK4 TMEM52
4 OR4G4P FAM87B SKI MIR200B KLHL17 ATAD3C OR4G4P MMP23B
5 MND2P28 SKI WASH7P LINC00115 FAM41C ANKRD65 SSU72 CDK11B
6 FAM87B GABRD MEGF6 ATAD3B PANK4 LINC01128 MND2P28 C1orf170可视化
# Upset 图
p <- as.ggplot(function(){
  top_annotation <- HeatmapAnnotation(
    Intersections = anno_barplot(
      cs, ylim = c(0, max(cs)*1.1),
      border = FALSE,
      gp = gpar(fill = "#000000", fontsize = 10),
      height = unit(5, "cm")
    ),
    annotation_name_side = "left",
    annotation_name_rot = 90
  )

  left_annotation <- rowAnnotation(
    Numbers = anno_barplot(-ss, axis_param = list(
      at = seq(-max(ss), 0, round(max(ss)/5)),
      labels = rev(seq(0, max(ss), round(max(ss)/5))),
      labels_rot = 0),
      baseline = 0,
      border = FALSE,
      gp = gpar(fill = "#000000", fontsize = 10),
      width = unit(4, "cm")
    ),
    set_name = anno_text(set_name(m), location = 0.5,  just = "center",
                         width = max_text_width(set_name(m)) + unit(5, "mm"))
  )

  ht = UpSet(m, comb_col = "#000000", bg_col = "#F0F0F0", bg_pt_col = "#CCCCCC",
             pt_size = unit(3, "mm"), lwd = 2, set_order = set_order,
             comb_order = comb_order, top_annotation = top_annotation,
             left_annotation = left_annotation,  right_annotation = NULL,
             show_row_names = FALSE)
  ht = draw(ht)
  od = column_order(ht)
  decorate_annotation("Intersections", {
    grid.text(cs[od], x = seq_along(cs), y = unit(cs[od], "native") + unit(2, "pt"),
              default.units = "native", just = c("left", "bottom"),
              gp = gpar(fontsize = 10, col = "#000000",
              fontfamily = "Arial"), hjust = 0.5)
  })
})
p <- p + ggtitle("Upset Plot") +
  theme(plot.title = element_text(hjust = 0.6))

p