# 安装包
if (!requireNamespace("waterfalls", quietly = TRUE)) {
  install.packages("waterfalls")
}
if (!requireNamespace("ggplot2", quietly = TRUE)) {
  install.packages("ggplot2")
}

# 加载包
library(waterfalls)
library(ggplot2)瀑布图2
注记
Hiplot 网站
本页面为 Hiplot Waterfalls Plot2 插件的源码版本教程,您也可以使用 Hiplot 网站实现无代码绘图,更多信息请查看以下链接:
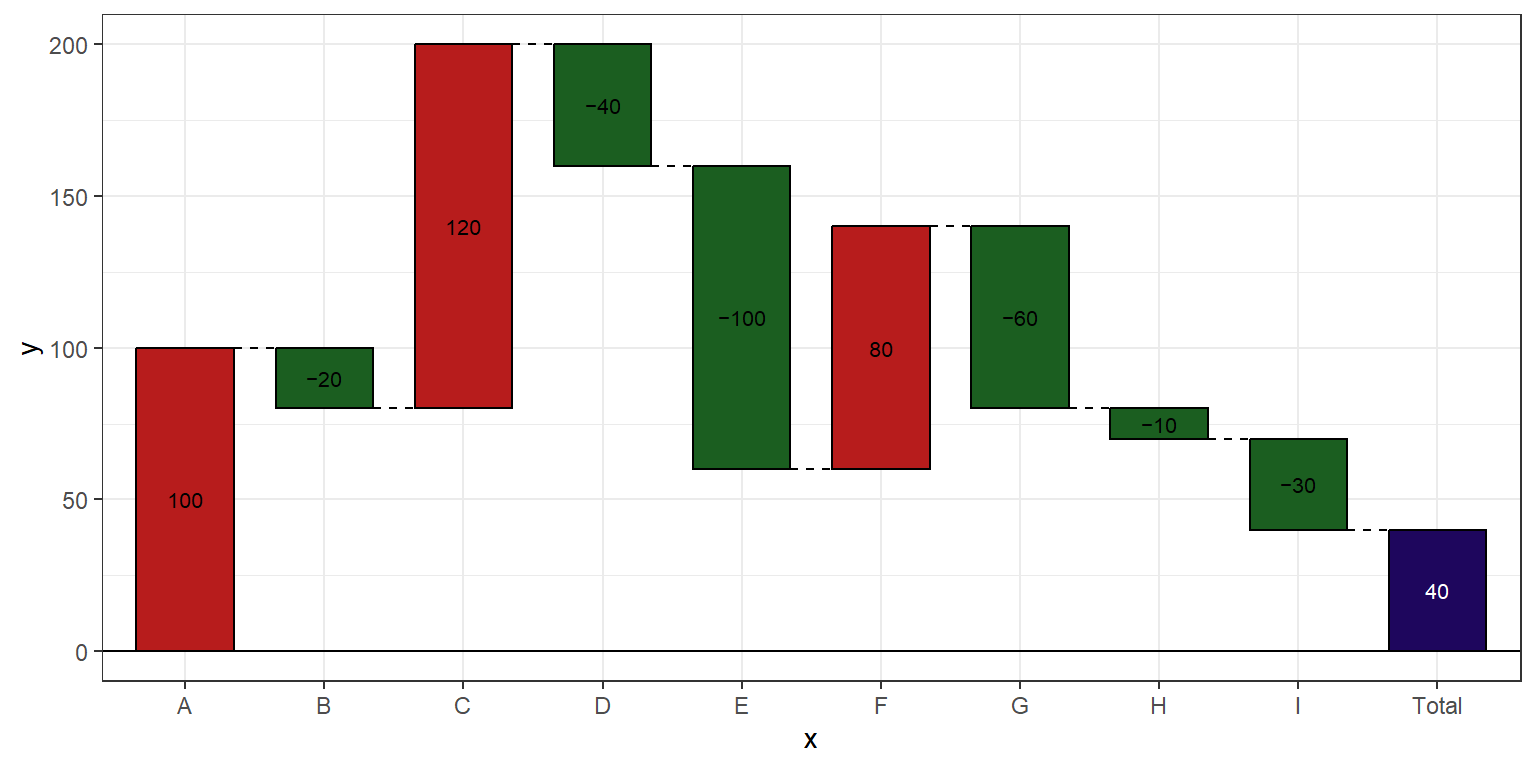
用于展示数据的变化情况,区别于1的一点是2可以自定义上升值和下降值颜色。
环境配置
系统: Cross-platform (Linux/MacOS/Windows)
编程语言: R
依赖包:
waterfalls;ggplot2
数据准备
# 加载数据
data <- read.delim("files/Hiplot/185-waterfalls-plot-data.txt", header = T)

# 整理数据格式
data[["name"]] <- factor(data[["name"]], levels = data[["name"]])
data$fill <- ifelse(data$value > 0, "#B71C1C", "#1B5E20")

# 查看数据
head(data)
name value fill
1 A 100 #B71C1C
2 B -20 #1B5E20
3 C 120 #B71C1C
4 D -40 #1B5E20
5 E -100 #1B5E20
6 F 80 #B71C1C可视化
# 瀑布图2
p <- waterfall(data, calc_total = T, rect_width = 0.7, fill_by_sign = F,
               fill_colours = data$fill, total_rect_color = "#1E065D") +
  theme_bw()

p