# 安装包
if (!requireNamespace("ggplot2", quietly = TRUE)) {
  install.packages("ggplot2")
}
if (!requireNamespace("ggthemes", quietly = TRUE)) {
  install.packages("ggthemes")
}
if (!requireNamespace("dplyr", quietly = TRUE)) {
  install.packages("dplyr")
}

# 加载包
library(ggplot2)
library(ggthemes)
library(dplyr)金字塔堆叠图
注记
Hiplot 网站
本页面为 Hiplot Pyramid Stack 插件的源码版本教程,您也可以使用 Hiplot 网站实现无代码绘图,更多信息请查看以下链接:
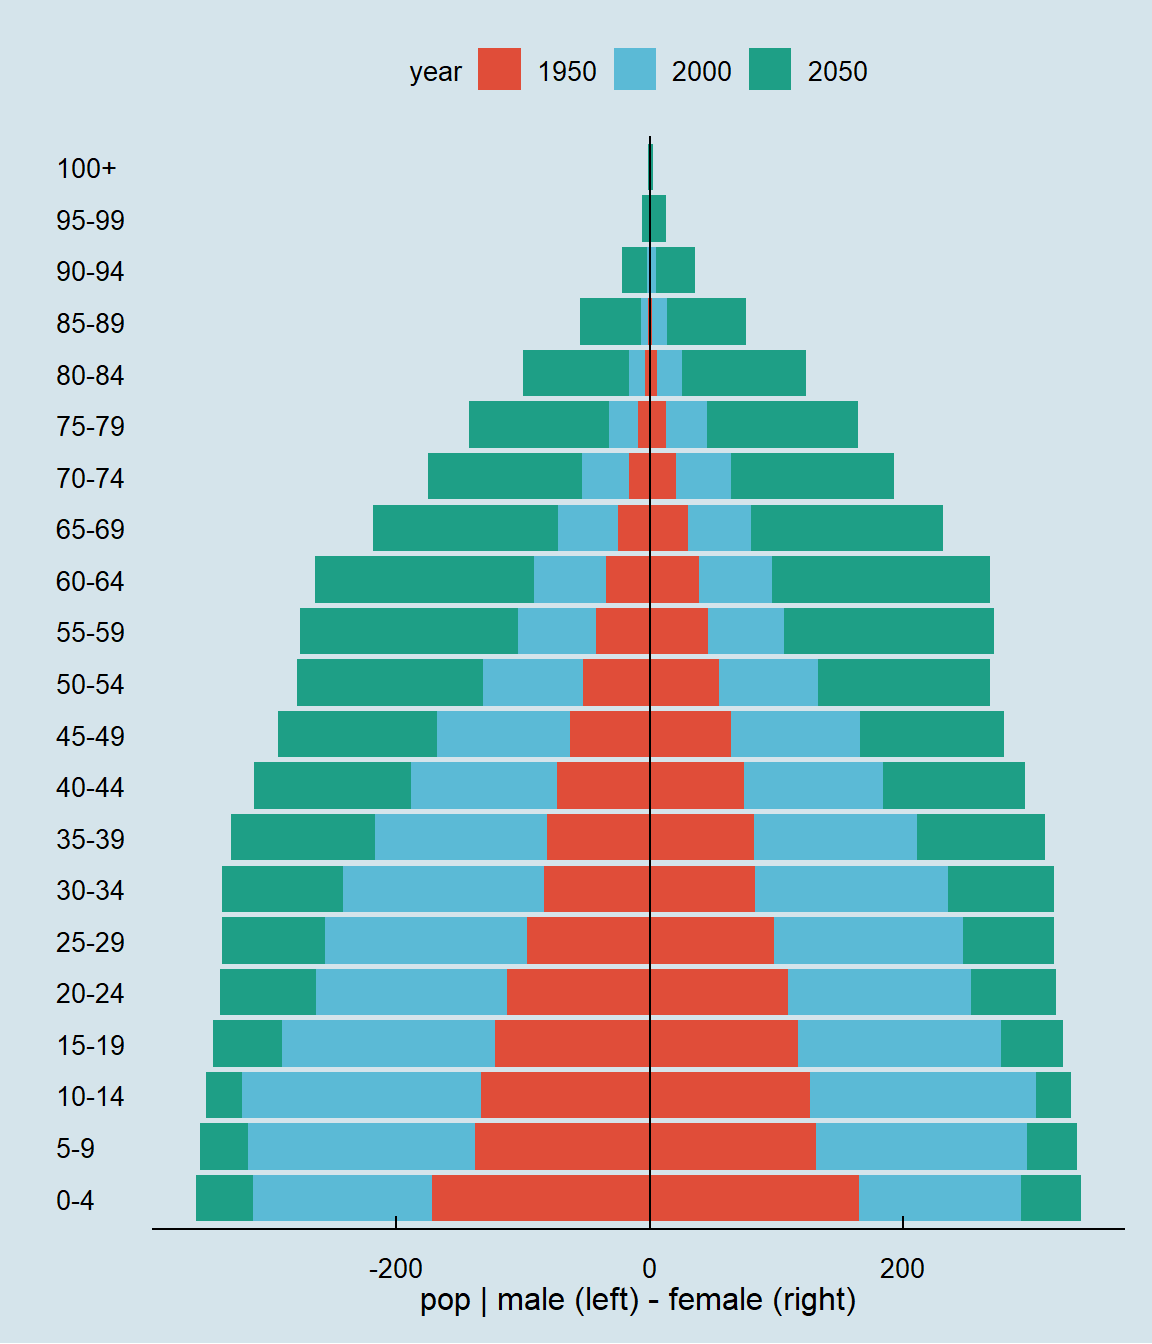
金字塔堆叠图可以用于展示年龄组多变量。
环境配置
系统: Cross-platform (Linux/MacOS/Windows)
编程语言: R
依赖包:
ggplot2;ggthemes;dplyr
数据准备
# 加载数据
data <- read.delim("files/Hiplot/146-pyramid-stack-data.txt", header = T)

# 整理数据格式
data[,3] <- factor(data[,3], levels = unique(data[,3]))
data[,1] <- factor(data[,1], levels = unique(data[,1]))

# 查看数据
head(data)
age gender year pop
1 0-4 male 1950 171.85124
2 5-9 male 1950 137.99242
3 10-14 male 1950 133.27428
4 15-19 male 1950 121.69274
5 20-24 male 1950 112.39438
6 25-29 male 1950 96.59408可视化
# 金字塔堆叠图
p <- ggplot(data = data, aes(x = age, y = pop, fill = year)) +
  geom_bar(data = data %>% filter(gender == "female") %>% arrange(rev(year)),
           stat = "identity", position = "identity") +
  geom_bar(data = data %>% filter(gender == "male") %>% arrange(rev(year)),
           stat = "identity", position = "identity", mapping = aes(y = -pop)) +
  coord_flip() +
  geom_hline(yintercept = 0) +
  scale_fill_economist() +
  scale_fill_manual(values = c("#e04d39","#5bbad6","#1e9f86")) +
  labs(y = "pop | male (left) - female (right)", x= "") +
  theme_economist(horizontal = FALSE) +
  theme(text = element_text(family = "Arial"),
        plot.title = element_text(size = 12,hjust = 0.5),
        axis.title = element_text(size = 12),
        axis.text = element_text(size = 10),
        axis.text.x = element_text(angle = 0, hjust = 0.5,vjust = 1),
        legend.position = "top",
        legend.direction = "horizontal",
        legend.title = element_text(size = 10),
        legend.text = element_text(size = 10),
        panel.grid.major = element_blank(),
        panel.grid.minor = element_blank())

p