# 安装包
if (!requireNamespace("rms", quietly = TRUE)) {
  install.packages("rms")
}
if (!requireNamespace("survival", quietly = TRUE)) {
  install.packages("survival")
}
if (!requireNamespace("ggplot2", quietly = TRUE)) {
  install.packages("ggplot2")
}
if (!requireNamespace("stringr", quietly = TRUE)) {
  install.packages("stringr")
}

# 加载包
library(rms)
library(survival)
library(ggplot2)
library(stringr)限制性立方样条模型
注记
Hiplot 网站
本页面为 Hiplot RCS-LRM 插件的源码版本教程,您也可以使用 Hiplot 网站实现无代码绘图,更多信息请查看以下链接:
非线性回归分析。
环境配置
系统: Cross-platform (Linux/MacOS/Windows)
编程语言: R
依赖包:
rms;survival;ggplot2;stringr
数据准备
# 加载数据
data <- read.delim("files/Hiplot/152-rcs-lrm-data.txt", header = T)

# 整理数据格式
data <- na.omit(data)
ex <- set::not(colnames(data), c("main", "group"))
ex <- str_c(ex, collapse = "+")
dd <<- datadist(data)
options(datadist = "dd")
for (i in 3:5) {
  fit <- lrm(as.formula(paste0("group~rcs(main,nk=i,inclx = T)+", ex, collapse = "+")), data = data, x = TRUE)
  tmp <- AIC(fit)
  if (i == 3) {
    AIC <- tmp
    nk <<- 3
  }
  if (tmp < AIC) {
    AIC <- tmp
    nk <<- i
  }
}
fit <- lrm(as.formula(paste0("group~rcs(main,nk=nk,inclx = T)+", ex, collapse = "+")), data = data, x = TRUE)
dd$limits$main[2] <- median(data$main)
fit <- update(fit)
orr <- Predict(fit, main, fun = exp, ref.zero = TRUE)

# 查看数据
head(data)
main X2 X3 group
1 100 0.90 0 1
2 90 0.65 1 1
3 400 1.36 0 1
4 200 0.83 0 1
5 300 1.38 0 1
6 200 0.69 0 1可视化
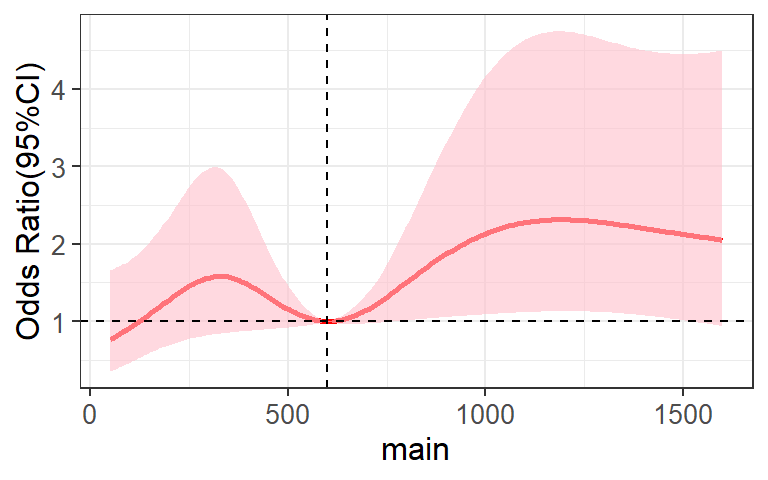
# 限制性立方样条模型
p <- ggplot() +
  geom_line(data = orr, aes(main, yhat), linetype = "solid", size = 1, alpha = 1,
            colour = "#FF0000") +
  geom_ribbon(data = orr, aes(main, ymin = lower, ymax = upper), alpha = 0.6,
              fill = "#FFC0CB") +
  geom_hline(yintercept = 1, linetype = 2, size = 0.5) +
  geom_vline(xintercept = dd$limits$main[2], linetype = 2, size = 0.5) +
  labs(x = "main", y = "Odds Ratio(95%CI)") +
  theme_bw() +
  theme(text = element_text(family = "Arial"),
        plot.title = element_text(size = 12,hjust = 0.5),
        axis.title = element_text(size = 12),
        axis.text = element_text(size = 10),
        axis.text.x = element_text(angle = 0, hjust = 0.5,vjust = 1),
        legend.position = "right",
        legend.direction = "vertical",
        legend.title = element_text(size = 10),
        legend.text = element_text(size = 10))

p