# 安装包
if (!requireNamespace("plotrix", quietly = TRUE)) {
  install.packages("plotrix")
}
if (!requireNamespace("ggplotify", quietly = TRUE)) {
  install.packages("ggplotify")
}

# 加载包
library(plotrix)
library(ggplotify)金字塔堆叠图2
注记
Hiplot 网站
本页面为 Hiplot Pyramid Stack2 插件的源码版本教程,您也可以使用 Hiplot 网站实现无代码绘图,更多信息请查看以下链接:
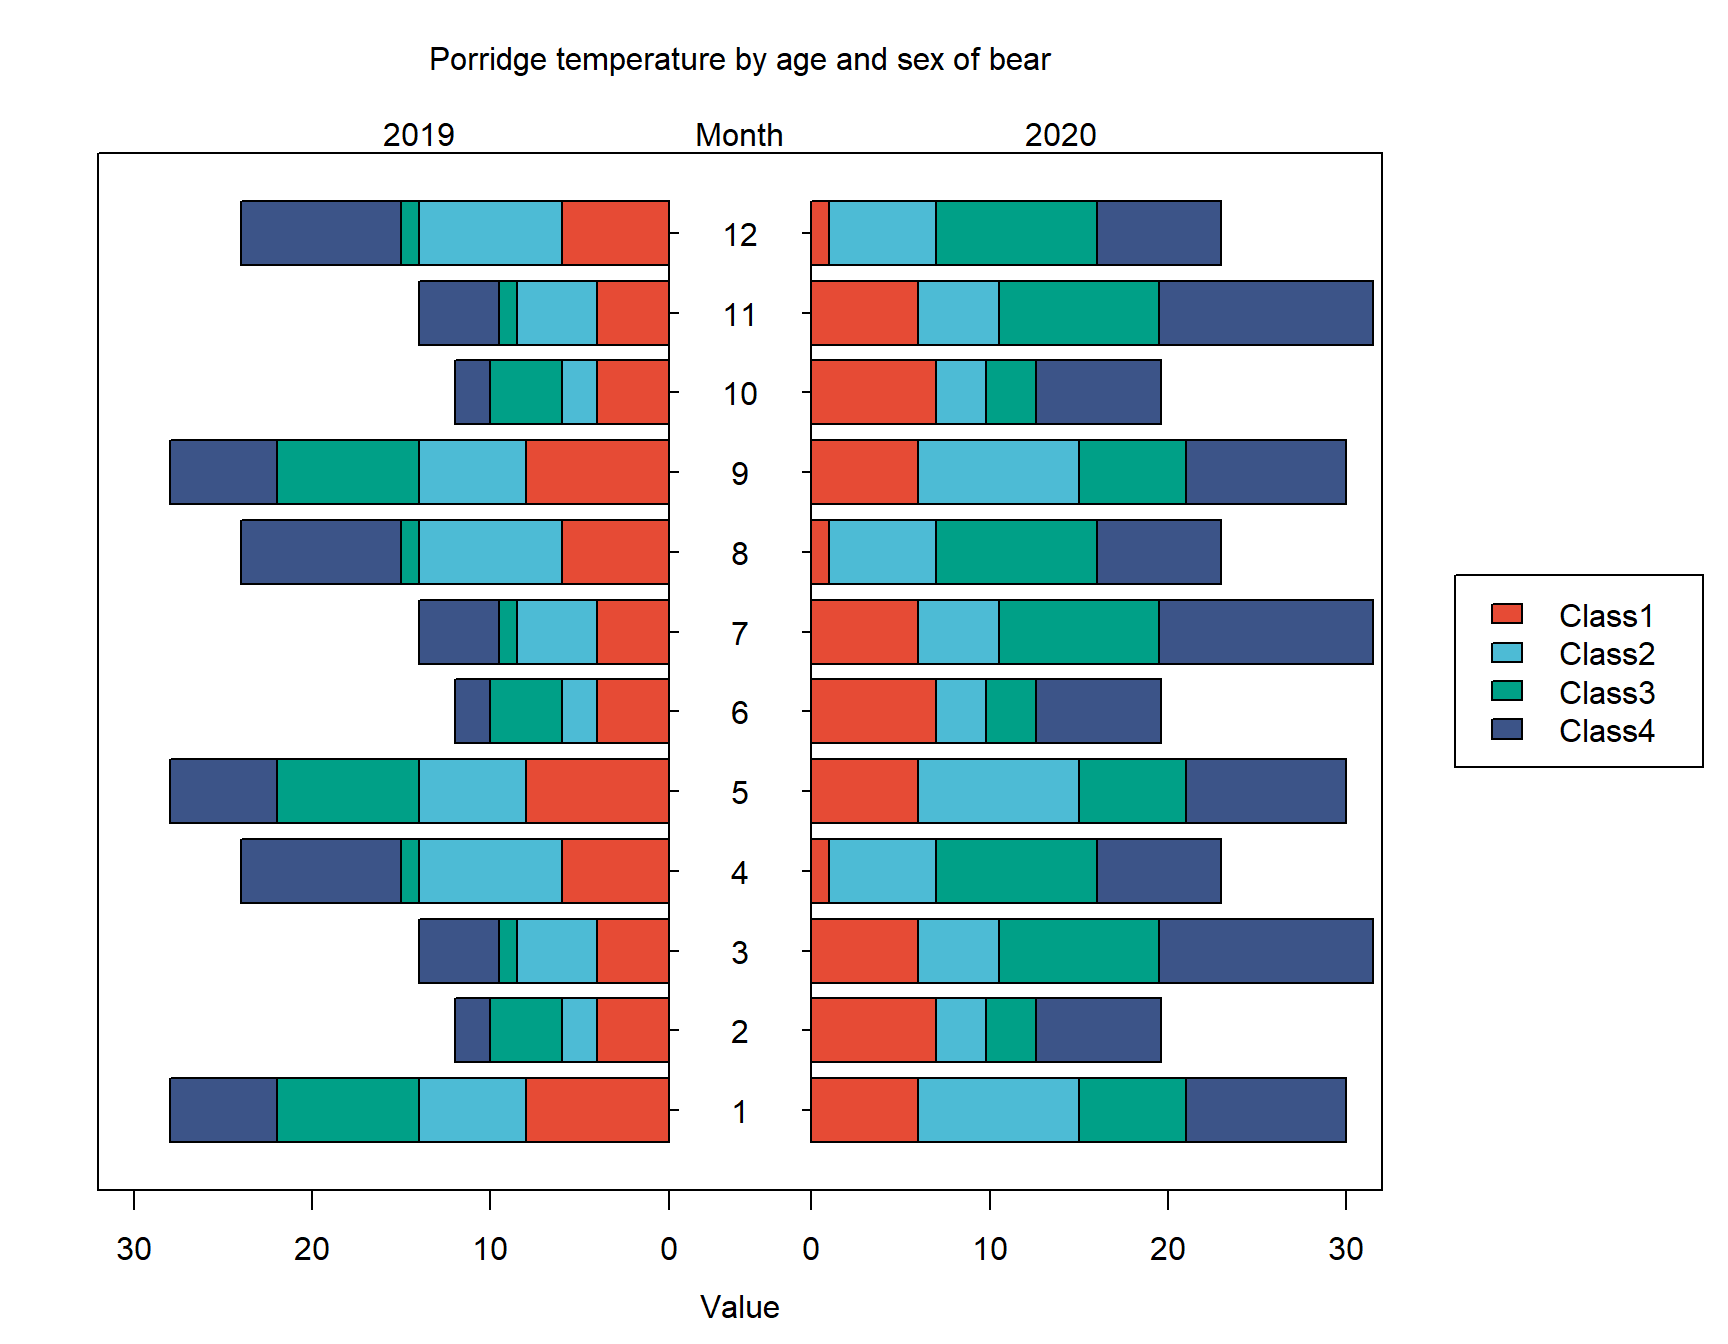
金字塔堆叠图可以用于展示年龄组多变量。
环境配置
系统: Cross-platform (Linux/MacOS/Windows)
编程语言: R
依赖包:
plotrix;ggplotify
数据准备
# 加载数据
data <- read.delim("files/Hiplot/147-pyramid-stack2-data.txt", header = T)

# 整理数据格式
agegrps <- unique(data[,1])
split_var <- unique(data[,2])
dat_left <- as.matrix(data[data[,2] == split_var[1],-c(1,2)])
dat_right <- as.matrix(data[data[,2] == split_var[2],-c(1,2)])

# 查看数据
head(data)
Month Year Class1 Class2 Class3 Class4
1 1 2019 8 6.0 8 6.0
2 2 2019 4 2.0 4 2.0
3 3 2019 4 4.5 1 4.5
4 4 2019 6 8.0 1 9.0
5 5 2019 8 6.0 8 6.0
6 6 2019 4 2.0 4 2.0可视化
# 金字塔堆叠图2
p <- as.ggplot(function() {
  cols <- c("#E64B35FF","#4DBBD5FF","#00A087FF","#3C5488FF")
  names(cols) <- colnames(dat_left)
  cols <- cols[1:ncol(dat_left)]
  pyramid.plot(dat_left, dat_right, labels = agegrps, unit = "Value",
               lxcol = cols, rxcol = cols,
               laxlab=as.numeric(c(0,10,20,30)), raxlab=as.numeric(c(0,10,20,30)),
               top.labels=c(split_var[1], colnames(data)[1], split_var[2]),
               gap=4, ppmar=c(4,2,4,7), do.first="plot_bg(\"#FFFFFF\")")
  mtext("Porridge temperature by age and sex of bear", 3, 2, cex=1)
  legend("right", inset=c(-0.25,0), legend = colnames(dat_left), fill = cols)
  })
32 32 p