# 安装包
if (!requireNamespace("patchwork", quietly = TRUE)) {
  install.packages("patchwork")
}
if (!requireNamespace("ggplotify", quietly = TRUE)) {
  install.packages("ggplotify")
}
if (!requireNamespace("cowplot", quietly = TRUE)) {
  install.packages("cowplot")
}

# 加载包
library(patchwork)
library(ggplotify)
library(cowplot)分组饼图
注记
Hiplot 网站
本页面为 Hiplot Pie Group 插件的源码版本教程,您也可以使用 Hiplot 网站实现无代码绘图,更多信息请查看以下链接:
环境配置
系统: Cross-platform (Linux/MacOS/Windows)
编程语言: R
依赖包:
patchwork;ggplotify;cowplot
数据准备
# 加载数据
data <- read.delim("files/Hiplot/139-pie-group-data.txt", header = T)

# 整理数据格式
data[,"genre"] <- factor(data[,"genre"], levels = unique(data[,"genre"]))
data[,"mpaa"] <- factor(data[,"mpaa"], levels = unique(data[,"mpaa"]))

# 查看数据
head(data)
title year length budget rating
1 Shawshank Redemption, The 1994 142 25 9.1
2 Lord of the Rings: The Return of the King, The 2003 251 94 9.0
3 Lord of the Rings: The Fellowship of the Ring, The 2001 208 93 8.8
4 Lord of the Rings: The Two Towers, The 2002 223 94 8.8
5 Pulp Fiction 1994 168 8 8.8
6 Schindler's List 1993 195 25 8.8
votes mpaa genre
1 149494 R Drama
2 103631 PG-13 Action
3 157608 PG-13 Action
4 114797 PG-13 Action
5 132745 R Drama
6 97667 R Drama可视化
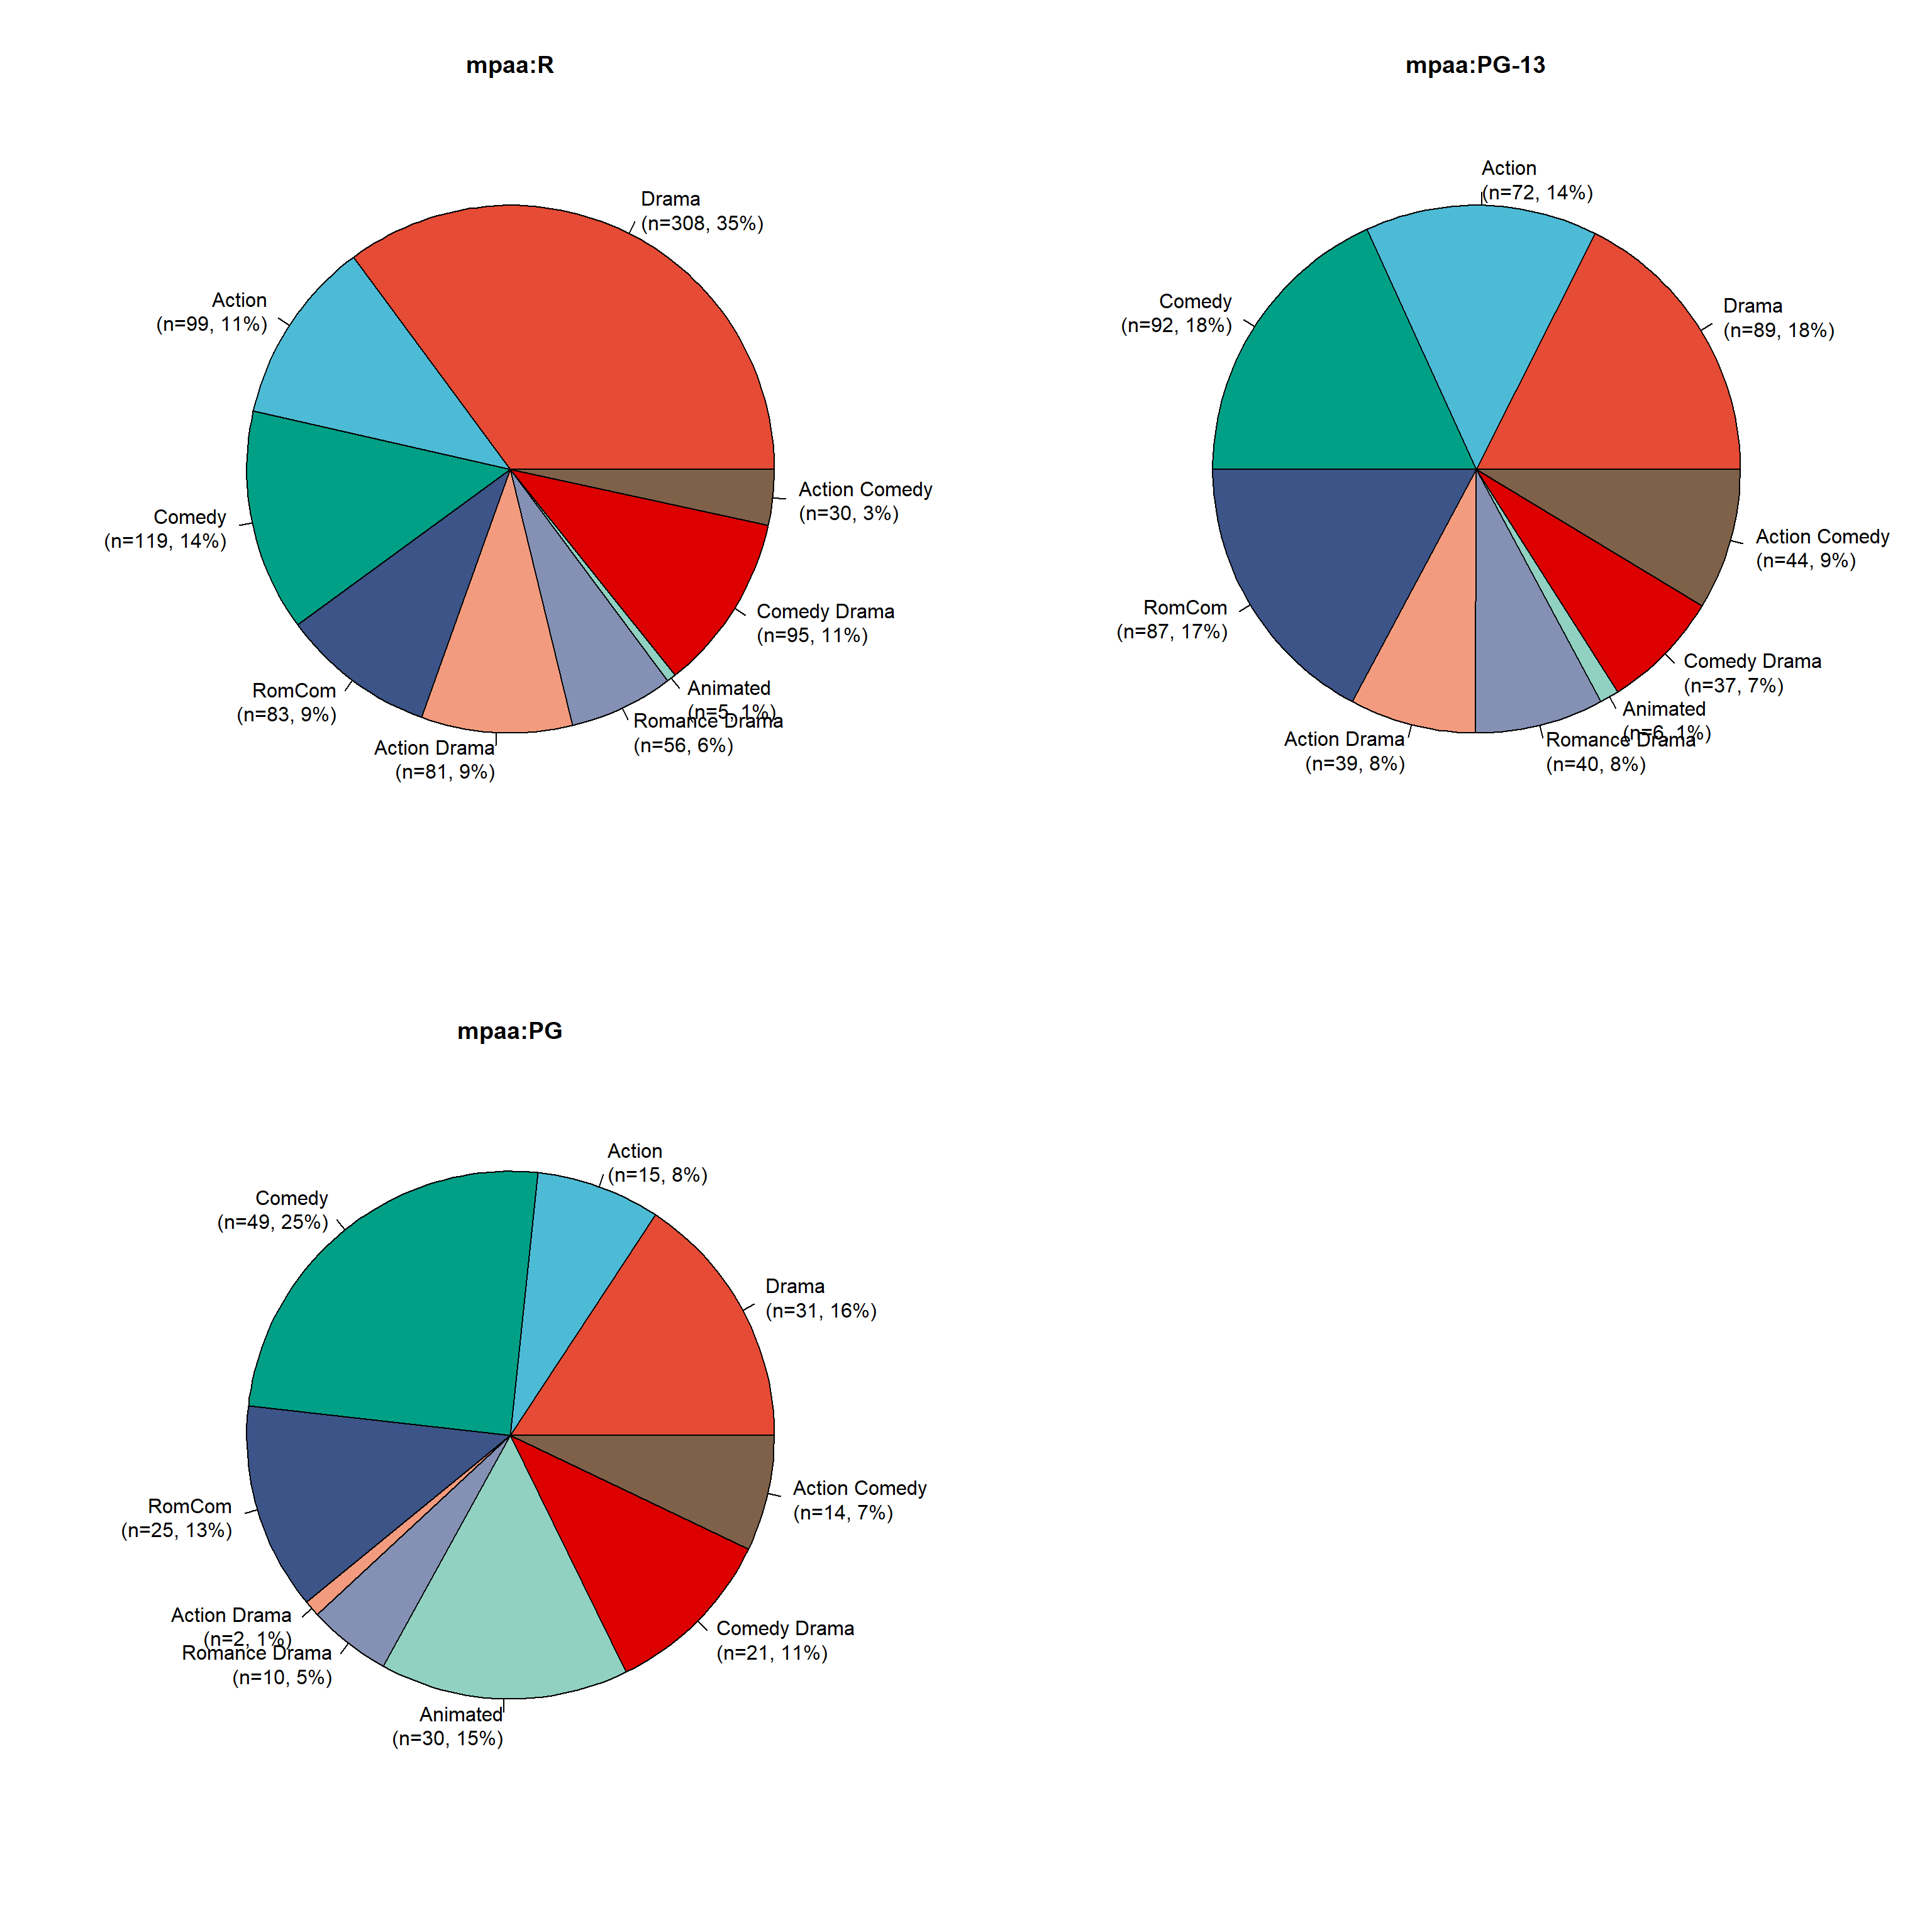
# 分组饼图
col <- c("#E64B35FF","#4DBBD5FF","#00A087FF","#3C5488FF","#F39B7FFF","#8491B4FF",
         "#91D1C2FF","#DC0000FF","#7E6148FF","#B09C85FF")
plist <- list()
for (i in 1:length(unique(data[,"mpaa"]))) {
  data_tmp <- data[data[,"mpaa"] == unique(data[,"mpaa"])[i],]
  x <- table(data_tmp[,"genre"])
  ptmp <- as.ggplot(function(){
    par(oma=c(0,0,0,0))
    pie(x,
      labels = sprintf("%s\n(n=%s, %s%%)", names(x), x,
        round(x / sum(x) * 100, 0)),
      col = col,
      main = paste0("mpaa", ":", unique(data[,"mpaa"])[i]),
      edges = 200,
      radius = 0.8,
      clockwise = F
    )
  })
  plist[[i]] <- ptmp
}

plot_grid(plotlist = plist, ncol = 2)