# 安装包
if (!requireNamespace("ggplotify", quietly = TRUE)) {
  install.packages("ggplotify")
}
if (!requireNamespace("likert", quietly = TRUE)) {
  install.packages("likert")
}

# 加载包
library(ggplotify)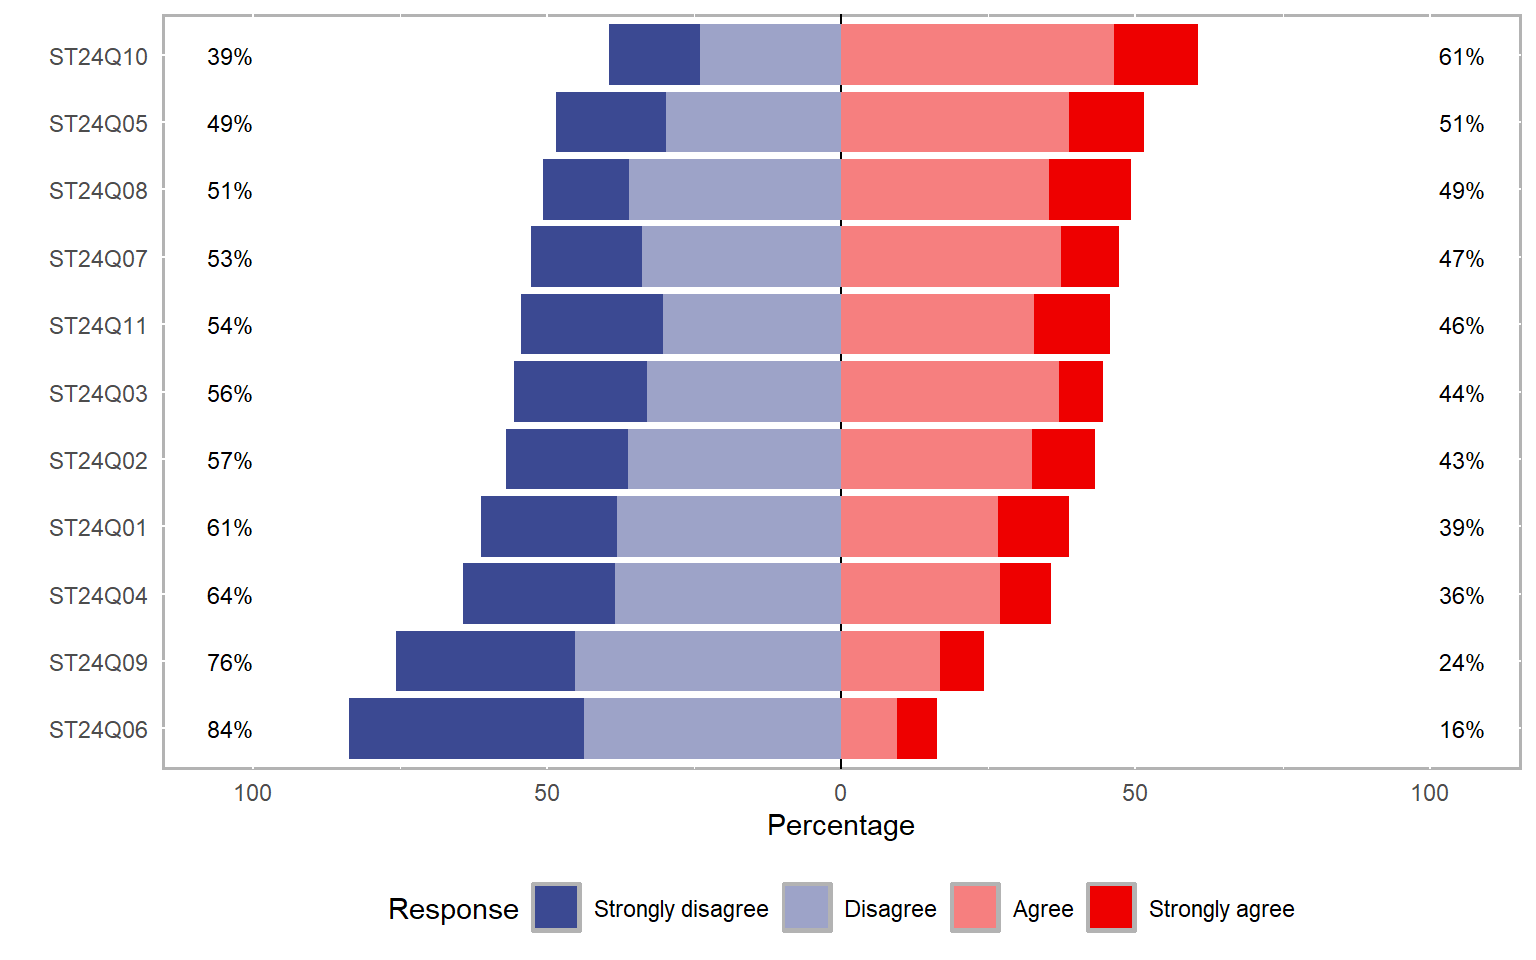
library(likert)李克特图
注记
Hiplot 网站
本页面为 Hiplot Likert Plot 插件的源码版本教程,您也可以使用 Hiplot 网站实现无代码绘图,更多信息请查看以下链接:
对李克特量表带数据进行可视化描述性统计分析。
环境配置
系统: Cross-platform (Linux/MacOS/Windows)
编程语言: R
依赖包:
ggplotify;likert
数据准备
# 加载数据
data <- read.delim("files/Hiplot/091-likert-data.txt", header = T)

# 整理数据格式
levs <- unique(unlist(data))
for (i in 1:ncol(data)) {
  data[,i] <- factor(data[, i], levels = levs)
}

# 查看数据
head(data)
ST24Q01 ST24Q02 ST24Q03 ST24Q04
1 Strongly disagree Strongly agree Agree Strongly disagree
2 Disagree Strongly agree Strongly agree Strongly disagree
3 Disagree Disagree Disagree Agree
4 Disagree Disagree Disagree Disagree
5 Disagree Agree Disagree Strongly disagree
6 Agree Strongly disagree Agree Strongly disagree
ST24Q05 ST24Q06 ST24Q07 ST24Q08
1 Agree Strongly disagree Agree Disagree
2 Strongly agree Strongly disagree Agree Disagree
3 Disagree Disagree Disagree Disagree
4 Disagree Strongly disagree Disagree Disagree
5 Agree Strongly disagree Strongly agree Strongly disagree
6 Strongly disagree Disagree Disagree Agree
ST24Q09 ST24Q10 ST24Q11
1 Strongly disagree Agree Agree
2 Strongly disagree Agree Agree
3 Disagree Disagree Disagree
4 Strongly disagree Disagree Disagree
5 Strongly disagree Strongly disagree Agree
6 Disagree Agree Strongly disagree可视化
# 李克特图
pobj <- likert(data)
colrs <- c("#3B4992FF","#EE0000FF")
p <- as.ggplot(plot(pobj, type = "bar",
                    low.color = colrs[1], high.color = colrs[2], wrap = 50))

p