# Install packages
if (!requireNamespace("igraph", quietly = TRUE)) {
  install.packages("igraph")
}
if (!requireNamespace("stringr", quietly = TRUE)) {
  install.packages("stringr")
}
if (!requireNamespace("ggplotify", quietly = TRUE)) {
  install.packages("ggplotify")
}
if (!requireNamespace("RColorBrewer", quietly = TRUE)) {
  install.packages("RColorBrewer")
}

# Load packages
library(igraph)
library(stringr)
library(ggplotify)
library(RColorBrewer)Network (igraph)
Note
Hiplot website
This page is the tutorial for source code version of the Hiplot Network (igraph) plugin. You can also use the Hiplot website to achieve no code ploting. For more information please see the following link:
Network (igraph) can be used to visulize basic network based on igraph.
Setup
System Requirements: Cross-platform (Linux/MacOS/Windows)
Programming language: R
Dependent packages:
igraph;stringr;ggplotify;RColorBrewer
Data Preparation
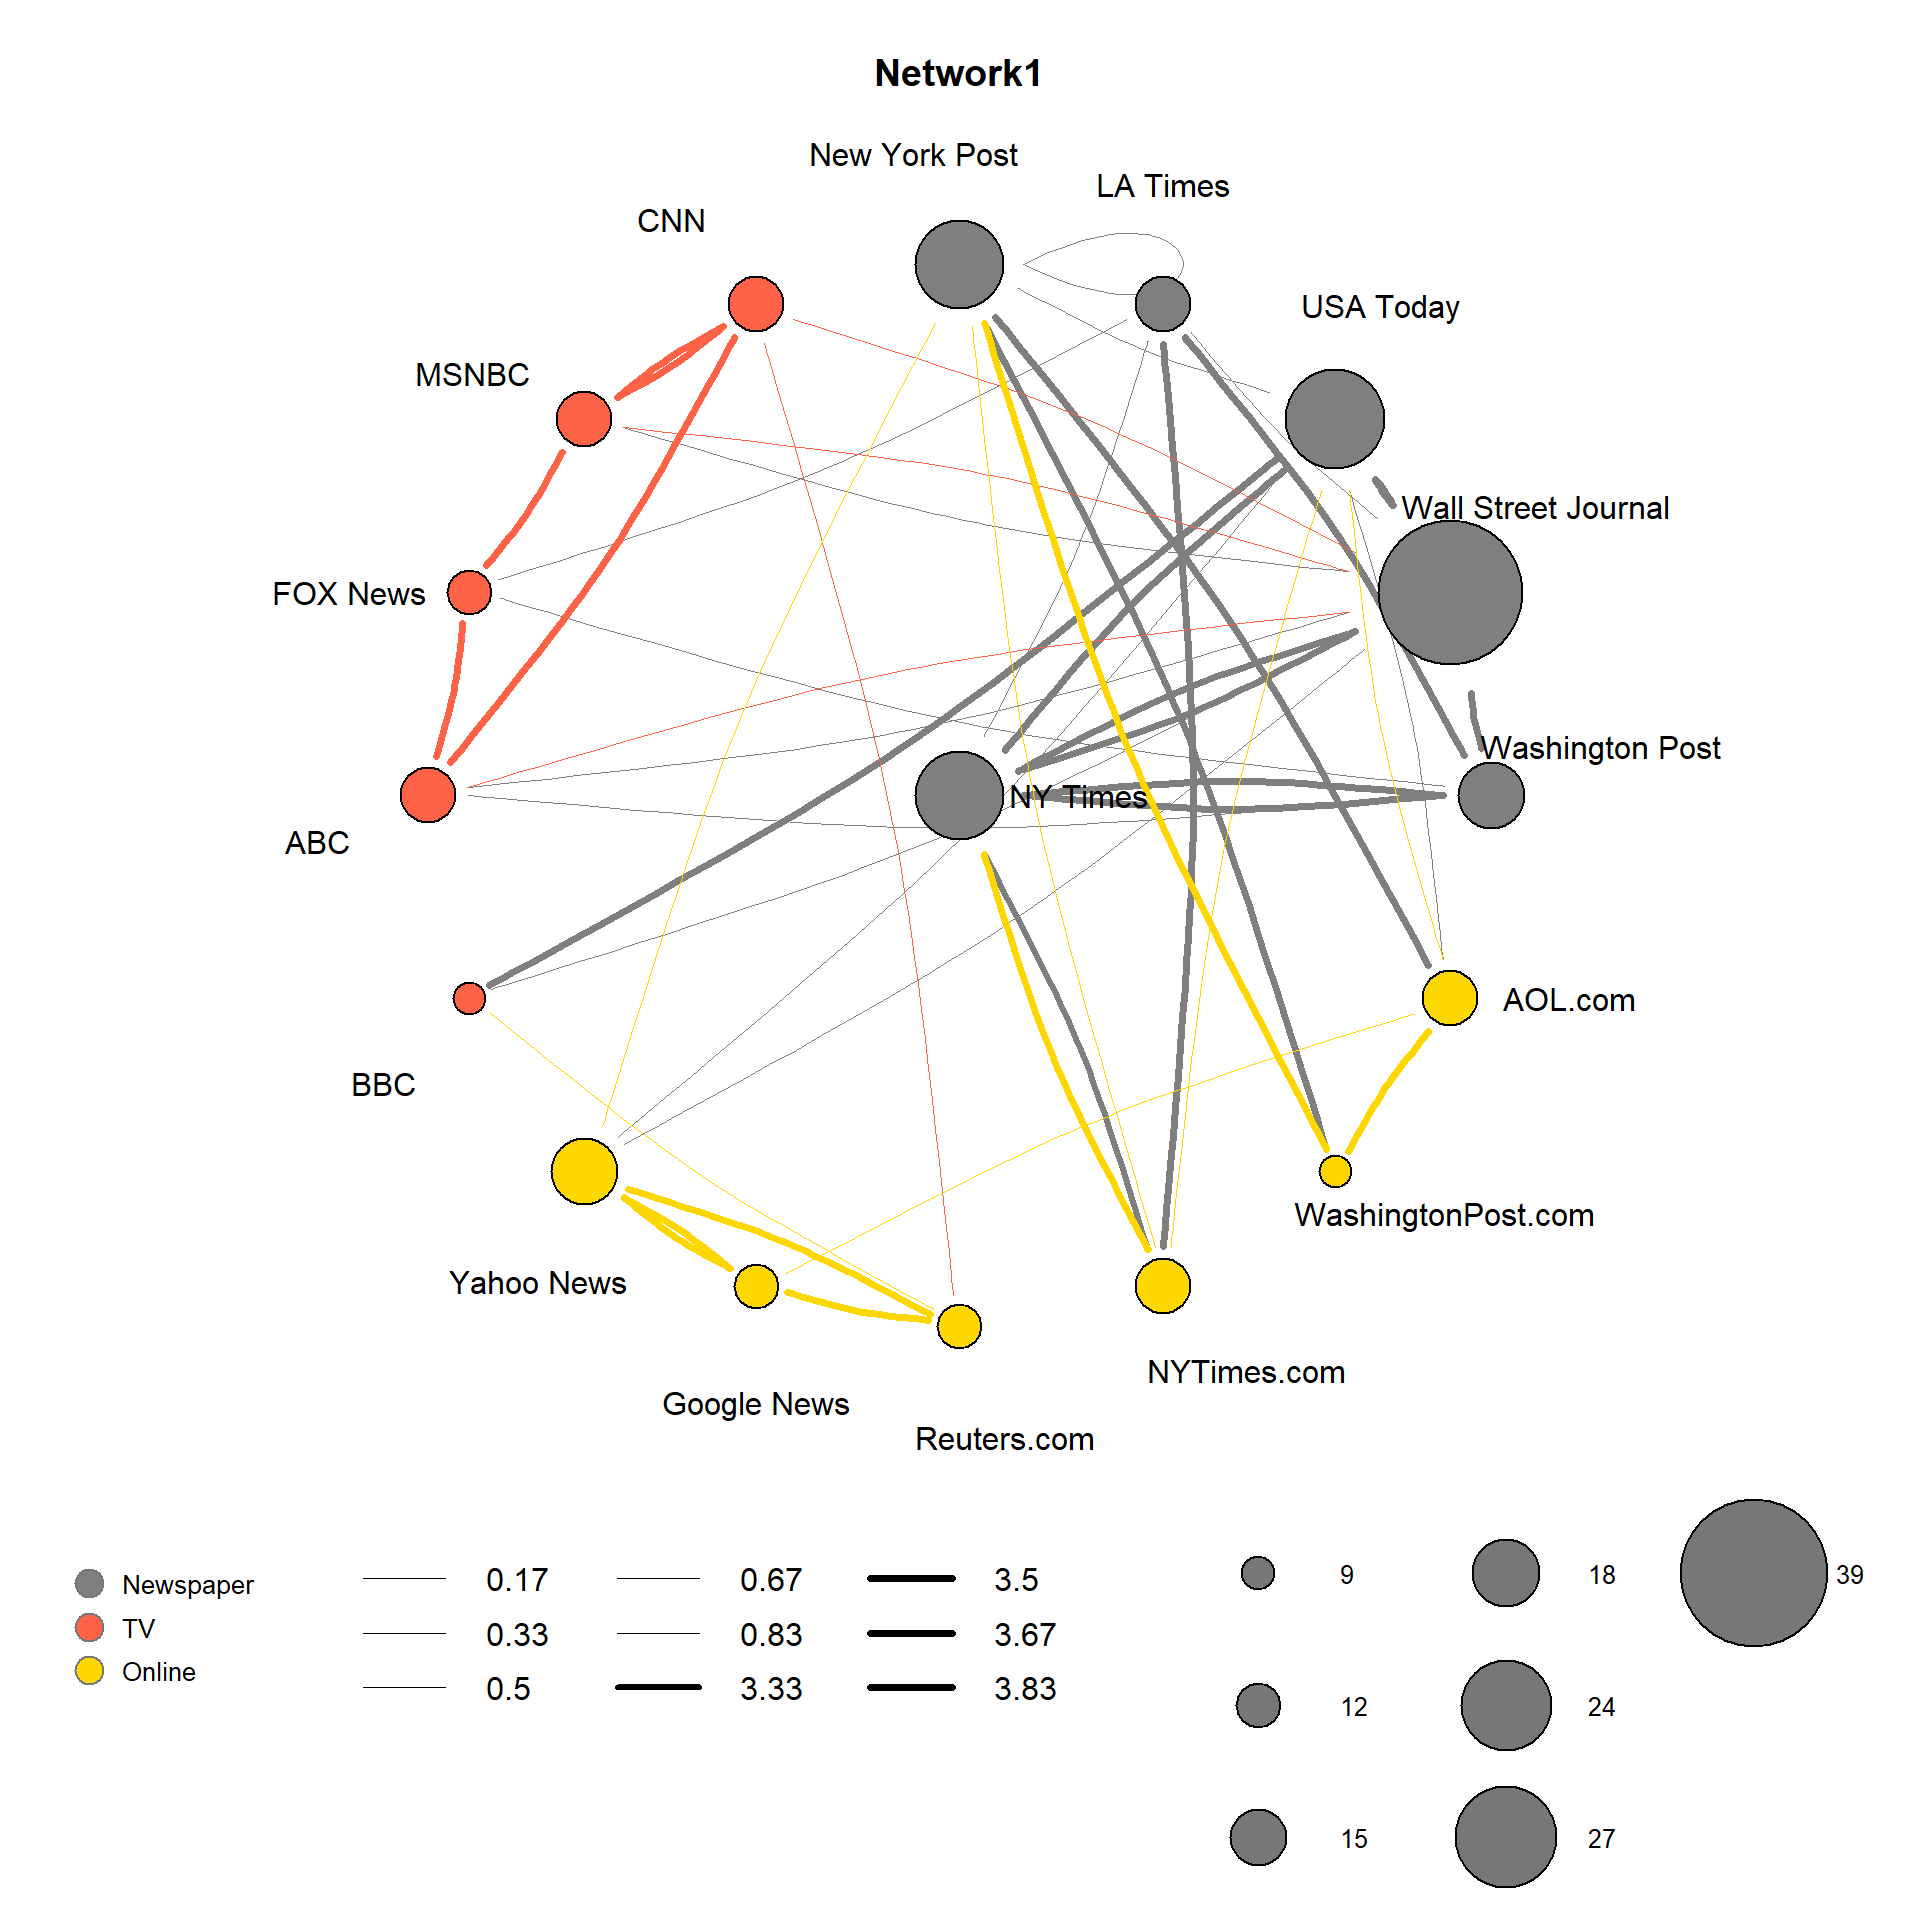
Two data tables need to be entered. Table 1 is node information, including node ID and other annotation information, which can be used to map color and size. Table 2 is the link information, including node ID and connection information between nodes.
# Load data
nodes_data <- read.delim("files/Hiplot/127-network-igraph-data1.txt", header = T)
edges_data <- read.delim("files/Hiplot/127-network-igraph-data2.txt", header = T)

# Convert data structure
nodes_data[,"type.label"] <- factor(nodes_data[,"type.label"],
                                    levels = unique(nodes_data[,"type.label"]))
nodes_data$hiplot_color_type <- as.numeric(nodes_data[,"type.label"])
net <- graph_from_data_frame(d = edges_data, vertices = nodes_data, directed = T)
## Generate colors based on type
colrs <- c("#7f7f7f","#ff6347","#ffd700")
colrs2 <- c("#BC3C29FF","#0072B5FF","#E18727FF","#20854EFF","#7876B1FF",
            "#6F99ADFF","#FFDC91FF","#EE4C97FF")
V(net)$color <- colrs[V(net)$hiplot_color_type]
## Compute node degrees (#links) and use that to set node size
deg <- degree(net, mode="all")
V(net)$size <- deg*3
## Set label
V(net)$label.color <- "black"
V(net)$label <- NA
## Set edge width based on weight
weight_column <- edges_data$weight
E(net)$width <- weight_column/6
## Change arrow size and edge color
E(net)$arrow.size <- .2
E(net)$edge.color <- "gray80"
edge.start <- ends(net, es=E(net), names=F)[,1]
edge.col <- V(net)$color[edge.start]

# View data
head(nodes_data)
id media media.type type.label audience.size hiplot_color_type
1 s01 NY Times 1 Newspaper 20 1
2 s02 Washington Post 1 Newspaper 25 1
3 s03 Wall Street Journal 1 Newspaper 30 1
4 s04 USA Today 1 Newspaper 32 1
5 s05 LA Times 1 Newspaper 20 1
6 s06 New York Post 1 Newspaper 50 1head(edges_data) from to type weight
1 s01 s02 hyperlink 22
2 s01 s03 hyperlink 22
3 s01 s04 hyperlink 21
4 s01 s15 mention 20
5 s02 s01 hyperlink 23
6 s02 s03 hyperlink 21Visualization
# Network (igraph)
raw <- par()
p <- as.ggplot(function () {
  par(mar=c(8,2,2,2))
  radian.rescale <- function(x, start=0, direction=1) {
    c.rotate <- function(x) (x + start) %% (4 * pi) * direction
    c.rotate(scales::rescale(x, c(0, 2 * pi), range(x)))
  }

  label <- eval(parse(text = sprintf("V(net)$%s", "media")))

  l <- do.call(layout_as_star, list(net))
  params <- list(net, layout = l, main = "Network1",
      edge.color = edge.col, edge.curved = .1,
      vertex.shape = "circle",
      edge.lty = "solid",
      label.family = "Arial",
      vertex.label.family = "Arial",
      vertex.label.dist = 3.1,
      edge.arrow.mode = F
  )
  lab.locs <- radian.rescale(x=1:length(label), direction=-1, start=0)
  params$vertex.label.degree <- lab.locs
  params$vertex.label <- label
  params$vertex.color = V(net)$color
  do.call(plot, params)
  legend(x = -1.7, y = -1.4, unique(nodes_data[,"type.label"]), pch = 21,
        col = "#777777", pt.bg = colrs, pt.cex = 2, cex = .8, bty = "n",
        ncol = 1)
  legend(x = -1.2, y = -1.37,
    legend=round(sort(unique(E(net)$width)), 2), pt.cex= 0.8,
      col='black', ncol = 3, bty = "n", lty = 1,
      lwd = round(sort(unique(E(net)$width)), 2)
  )
  if (length(unique(V(net)$size)) > 8) {
    size_leg <- sort(unique(V(net)$size))[seq(1, length(unique(V(net)$size)), 2)]
  } else {
    size_leg <- sort(unique(V(net)$size))
  }
  legend(x = 0.5, y = -1.3,
        size_leg,
        pch = 21,
        col = "black", pt.bg = "#777777",
        pt.cex = size_leg / 3.8, cex = .8, bty = "n",
        ncol = 3,
        y.intersp = 3,
        x.intersp = 2.5,
        text.width = 0.25
  )
  par(mar=raw$mar)
})

p