# Install packages
if (!requireNamespace("ggplot2", quietly = TRUE)) {
  install.packages("ggplot2")
}
if (!requireNamespace("ggthemes", quietly = TRUE)) {
  install.packages("ggthemes")
}
if (!requireNamespace("dplyr", quietly = TRUE)) {
  install.packages("dplyr")
}

# Load packages
library(ggplot2)
library(ggthemes)
library(dplyr)Pyramid Stack
Note
Hiplot website
This page is the tutorial for source code version of the Hiplot Pyramid Stack plugin. You can also use the Hiplot website to achieve no code ploting. For more information please see the following link:
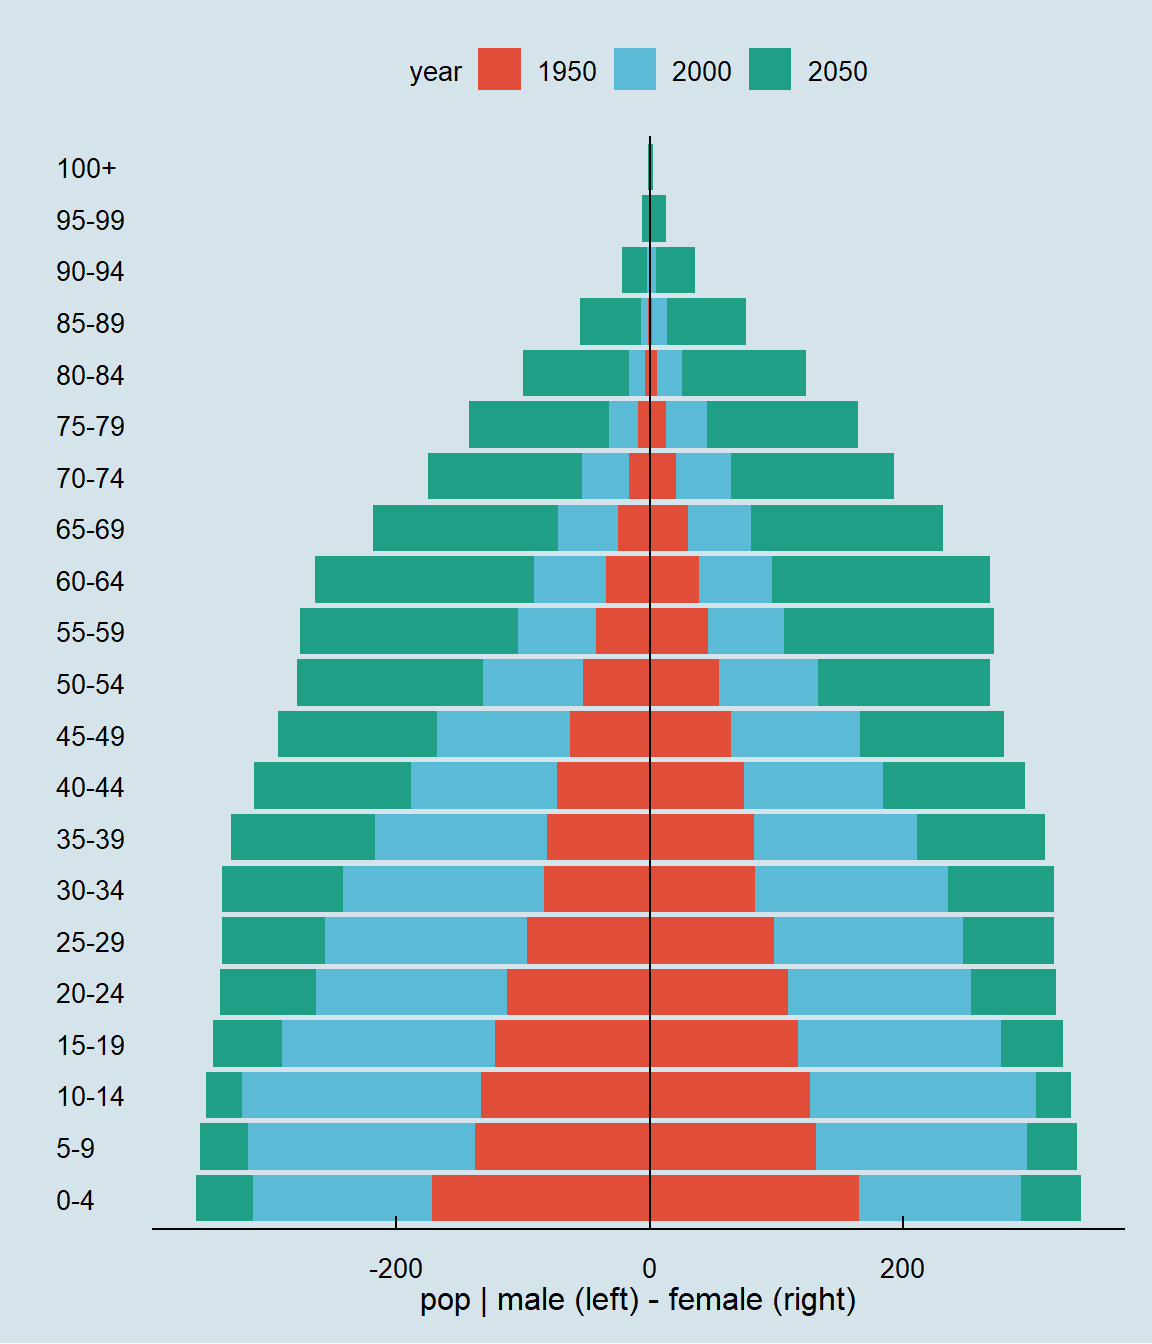
The pyramid stack is a pyramid-like figure that distributes data on both sides of a central axis.
Setup
System Requirements: Cross-platform (Linux/MacOS/Windows)
Programming language: R
Dependent packages:
ggplot2;ggthemes;dplyr
Data Preparation
# Load data
data <- read.delim("files/Hiplot/146-pyramid-stack-data.txt", header = T)

# Convert data structure
data[,3] <- factor(data[,3], levels = unique(data[,3]))
data[,1] <- factor(data[,1], levels = unique(data[,1]))

# View data
head(data)
age gender year pop
1 0-4 male 1950 171.85124
2 5-9 male 1950 137.99242
3 10-14 male 1950 133.27428
4 15-19 male 1950 121.69274
5 20-24 male 1950 112.39438
6 25-29 male 1950 96.59408Visualization
# Pyramid Stack
p <- ggplot(data = data, aes(x = age, y = pop, fill = year)) +
  geom_bar(data = data %>% filter(gender == "female") %>% arrange(rev(year)),
           stat = "identity", position = "identity") +
  geom_bar(data = data %>% filter(gender == "male") %>% arrange(rev(year)),
           stat = "identity", position = "identity", mapping = aes(y = -pop)) +
  coord_flip() +
  geom_hline(yintercept = 0) +
  scale_fill_economist() +
  scale_fill_manual(values = c("#e04d39","#5bbad6","#1e9f86")) +
  labs(y = "pop | male (left) - female (right)", x= "") +
  theme_economist(horizontal = FALSE) +
  theme(text = element_text(family = "Arial"),
        plot.title = element_text(size = 12,hjust = 0.5),
        axis.title = element_text(size = 12),
        axis.text = element_text(size = 10),
        axis.text.x = element_text(angle = 0, hjust = 0.5,vjust = 1),
        legend.position = "top",
        legend.direction = "horizontal",
        legend.title = element_text(size = 10),
        legend.text = element_text(size = 10),
        panel.grid.major = element_blank(),
        panel.grid.minor = element_blank())

p