# Install packages
if (!requireNamespace("meta", quietly = TRUE)) {
  install.packages("meta")
}
if (!requireNamespace("ggplotify", quietly = TRUE)) {
  install.packages("ggplotify")
}

# Load packages
library(meta)
library(ggplotify)Meta-analysis of Binary Data
Note
Hiplot website
This page is the tutorial for source code version of the Hiplot Meta-analysis of Binary Data plugin. You can also use the Hiplot website to achieve no code ploting. For more information please see the following link:
Setup
System Requirements: Cross-platform (Linux/MacOS/Windows)
Programming language: R
Dependent packages:
meta;ggplotify
Data Preparation
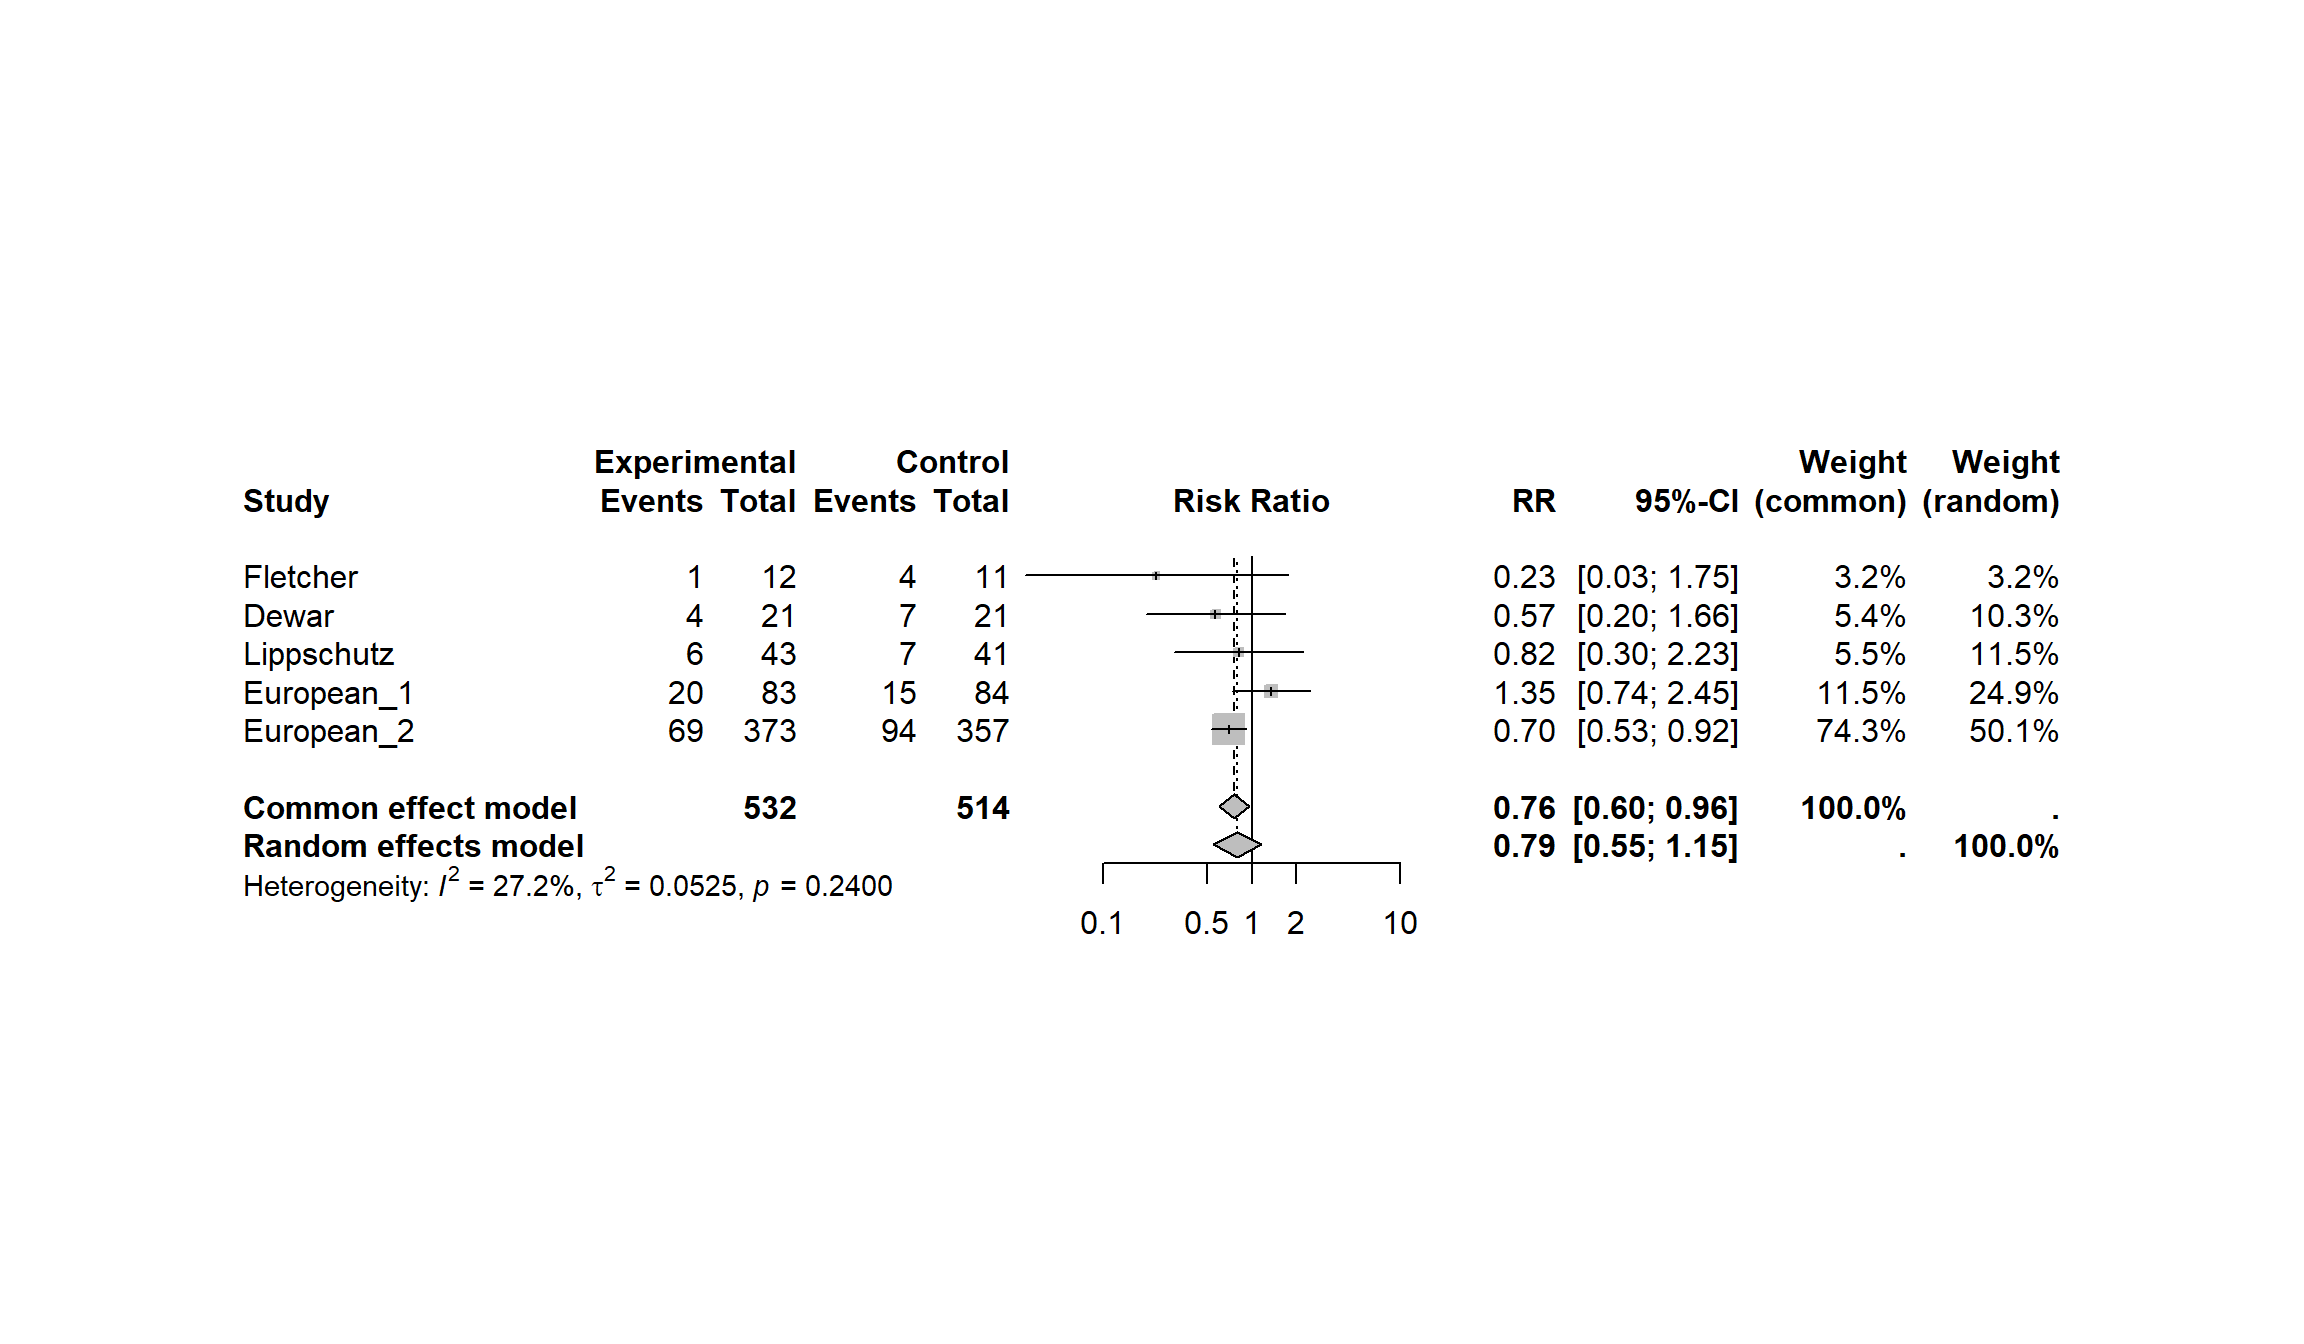
# Load data
data <- read.delim("files/Hiplot/119-meta-bin-data.txt", header = T)

# Convert data structure
m1 <- metabin(ev.exp, n.exp, ev.cont, n.cont, studlab = Study, data = data)

# View data
head(data)
Study ev.exp n.exp ev.cont n.cont
1 Fletcher 1 12 4 11
2 Dewar 4 21 7 21
3 Lippschutz 6 43 7 41
4 European_1 20 83 15 84
5 European_2 69 373 94 357Visualization
# Meta-analysis of Binary Data
p <- as.ggplot(function(){
  meta::forest(m1, layout = "meta")
  })

p