# Install packages
if (!requireNamespace("EnhancedVolcano", quietly = TRUE)) {
  install_github('kevinblighe/EnhancedVolcano')
}

# Load packages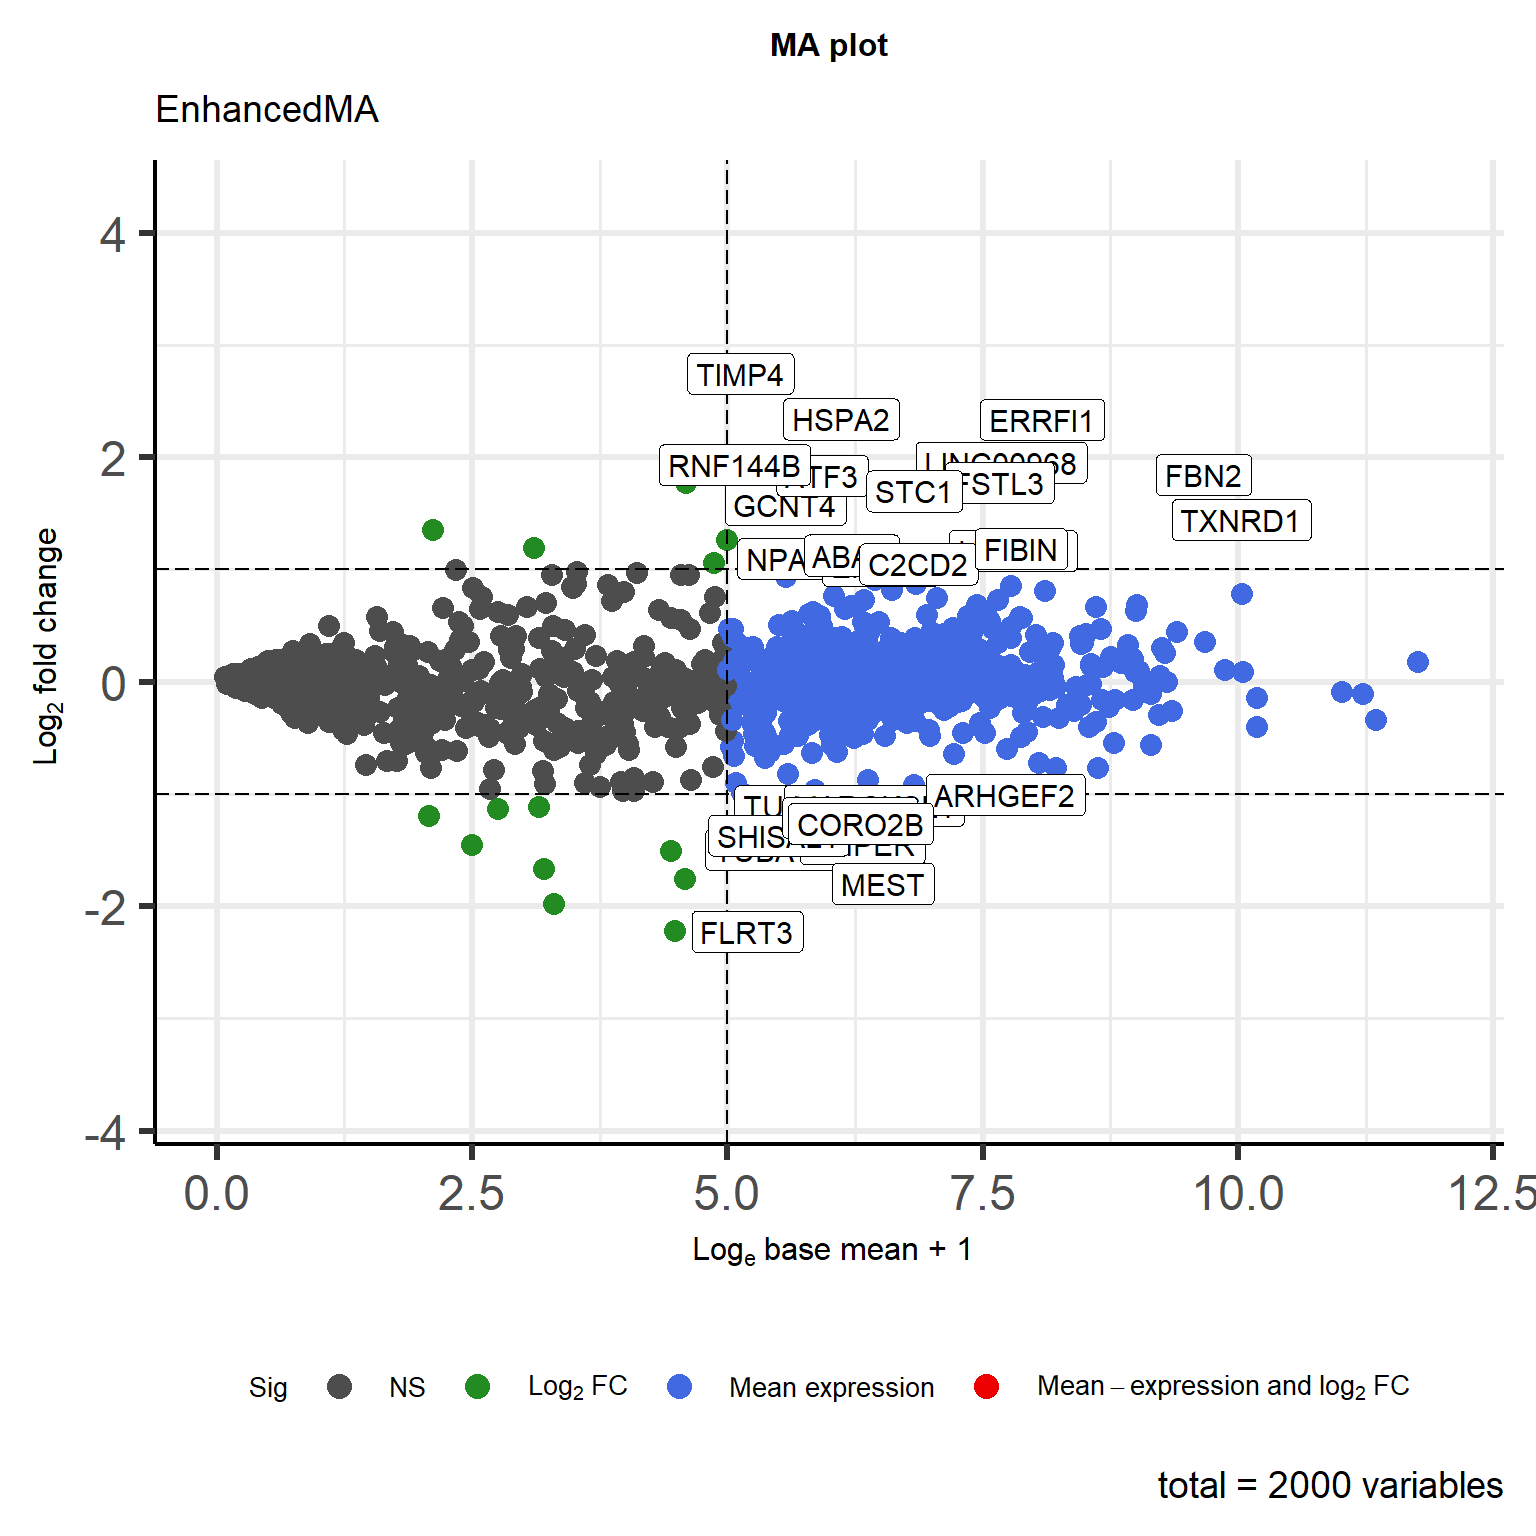
library(EnhancedVolcano)EnhancedMA
Note
Hiplot website
This page is the tutorial for source code version of the Hiplot EnhancedMA plugin. You can also use the Hiplot website to achieve no code ploting. For more information please see the following link:
Visualization of differentially expressed genes.
Setup
System Requirements: Cross-platform (Linux/MacOS/Windows)
Programming language: R
Dependent packages:
EnhancedVolcano
Data Preparation
# Load data
data <- read.delim("files/Hiplot/143-pseudo-enhanced-ma-data.txt", header = T)

# Convert data structure
row.names(data) <- data[,1]
data <- data[,-1]
data$baseMeanNew <- 1 / (10^log(data$baseMean + 1))

# View data
head(data)
baseMean log2FoldChange lfcSE stat pvalue
COL6A3 8.494143e+04 -0.34453583 0.07607842 -4.5305972 5.881720e-06
ZNF157 2.456747e+00 -0.42976616 0.33693867 -1.2957785 1.950518e-01
RPL23P11 0.000000e+00 NA NA NA NA
SCARNA10 4.406548e-01 -0.05657159 0.15265730 -0.2329492 8.158009e-01
RNU6-857P 0.000000e+00 NA NA NA NA
TOPORS 5.331777e+02 0.10709656 0.12572643 0.8549637 3.925712e-01
padj baseMeanNew
COL6A3 6.207728e-05 4.469624e-12
ZNF157 NA 5.750056e-02
RPL23P11 NA 1.000000e+00
SCARNA10 NA 4.314220e-01
RNU6-857P NA 1.000000e+00
TOPORS 6.148749e-01 5.239278e-07Visualization
# EnhancedMA
p <- EnhancedVolcano(
  data, lab = rownames(data), title = "MA plot", subtitle = "EnhancedMA",
  x = 'log2FoldChange', y = 'baseMeanNew', xlab = bquote(~Log[2]~ 'fold change'),
  ylab = bquote(~Log[e]~ 'base mean + 1'), ylim = c(0,12),
  pCutoff = as.numeric(1e-05), FCcutoff = 1, pointSize = 3.5,
  labSize = 4, boxedLabels = T, colAlpha = 1,
  legendLabels = c('NS', expression(Log[2]~FC),
                   'Mean expression',
                   expression(Mean-expression~and~log[2]~FC)),
  legendPosition = "bottom", legendLabSize = 16, legendIconSize = 4.0,
  encircleCol = 'black', encircleSize = 2.5, encircleFill = 'pink',
  encircleAlpha = 1/2) +
  coord_flip() +
  theme(text = element_text(family = "Arial"),
        plot.title = element_text(size = 12,hjust = 0.5),
        axis.title = element_text(size = 12),
        axis.text = element_text(size = 10),
        axis.text.x = element_text(angle = 0, hjust = 0.5,vjust = 1),
        legend.title = element_text(size = 10),
        legend.text = element_text(size = 10))

p