# Install packages
if (!requireNamespace("flow", quietly = TRUE)) {
  install.packages("flow")
}

# Load packages
library(flow)R Script Flow
Note
Hiplot website
This page is the tutorial for source code version of the Hiplot R Script Flow plugin. You can also use the Hiplot website to achieve no code ploting. For more information please see the following link:
R script flow can realize the visual window of if, else and other logic functions.
Setup
System Requirements: Cross-platform (Linux/MacOS/Windows)
Programming language: R
Dependent packages:
flow
Data Preparation
The loaded data are if, else function code of R.
# Load data
code <- function(){
  if (x < 10) {
    a <- 1
  } else {
    a <- 2
  }
  if (a == 2) {
    c <- d
  } else {
    d <- a
  }
}
Visualization
# R Script Flow
p <- flow_view(code)

p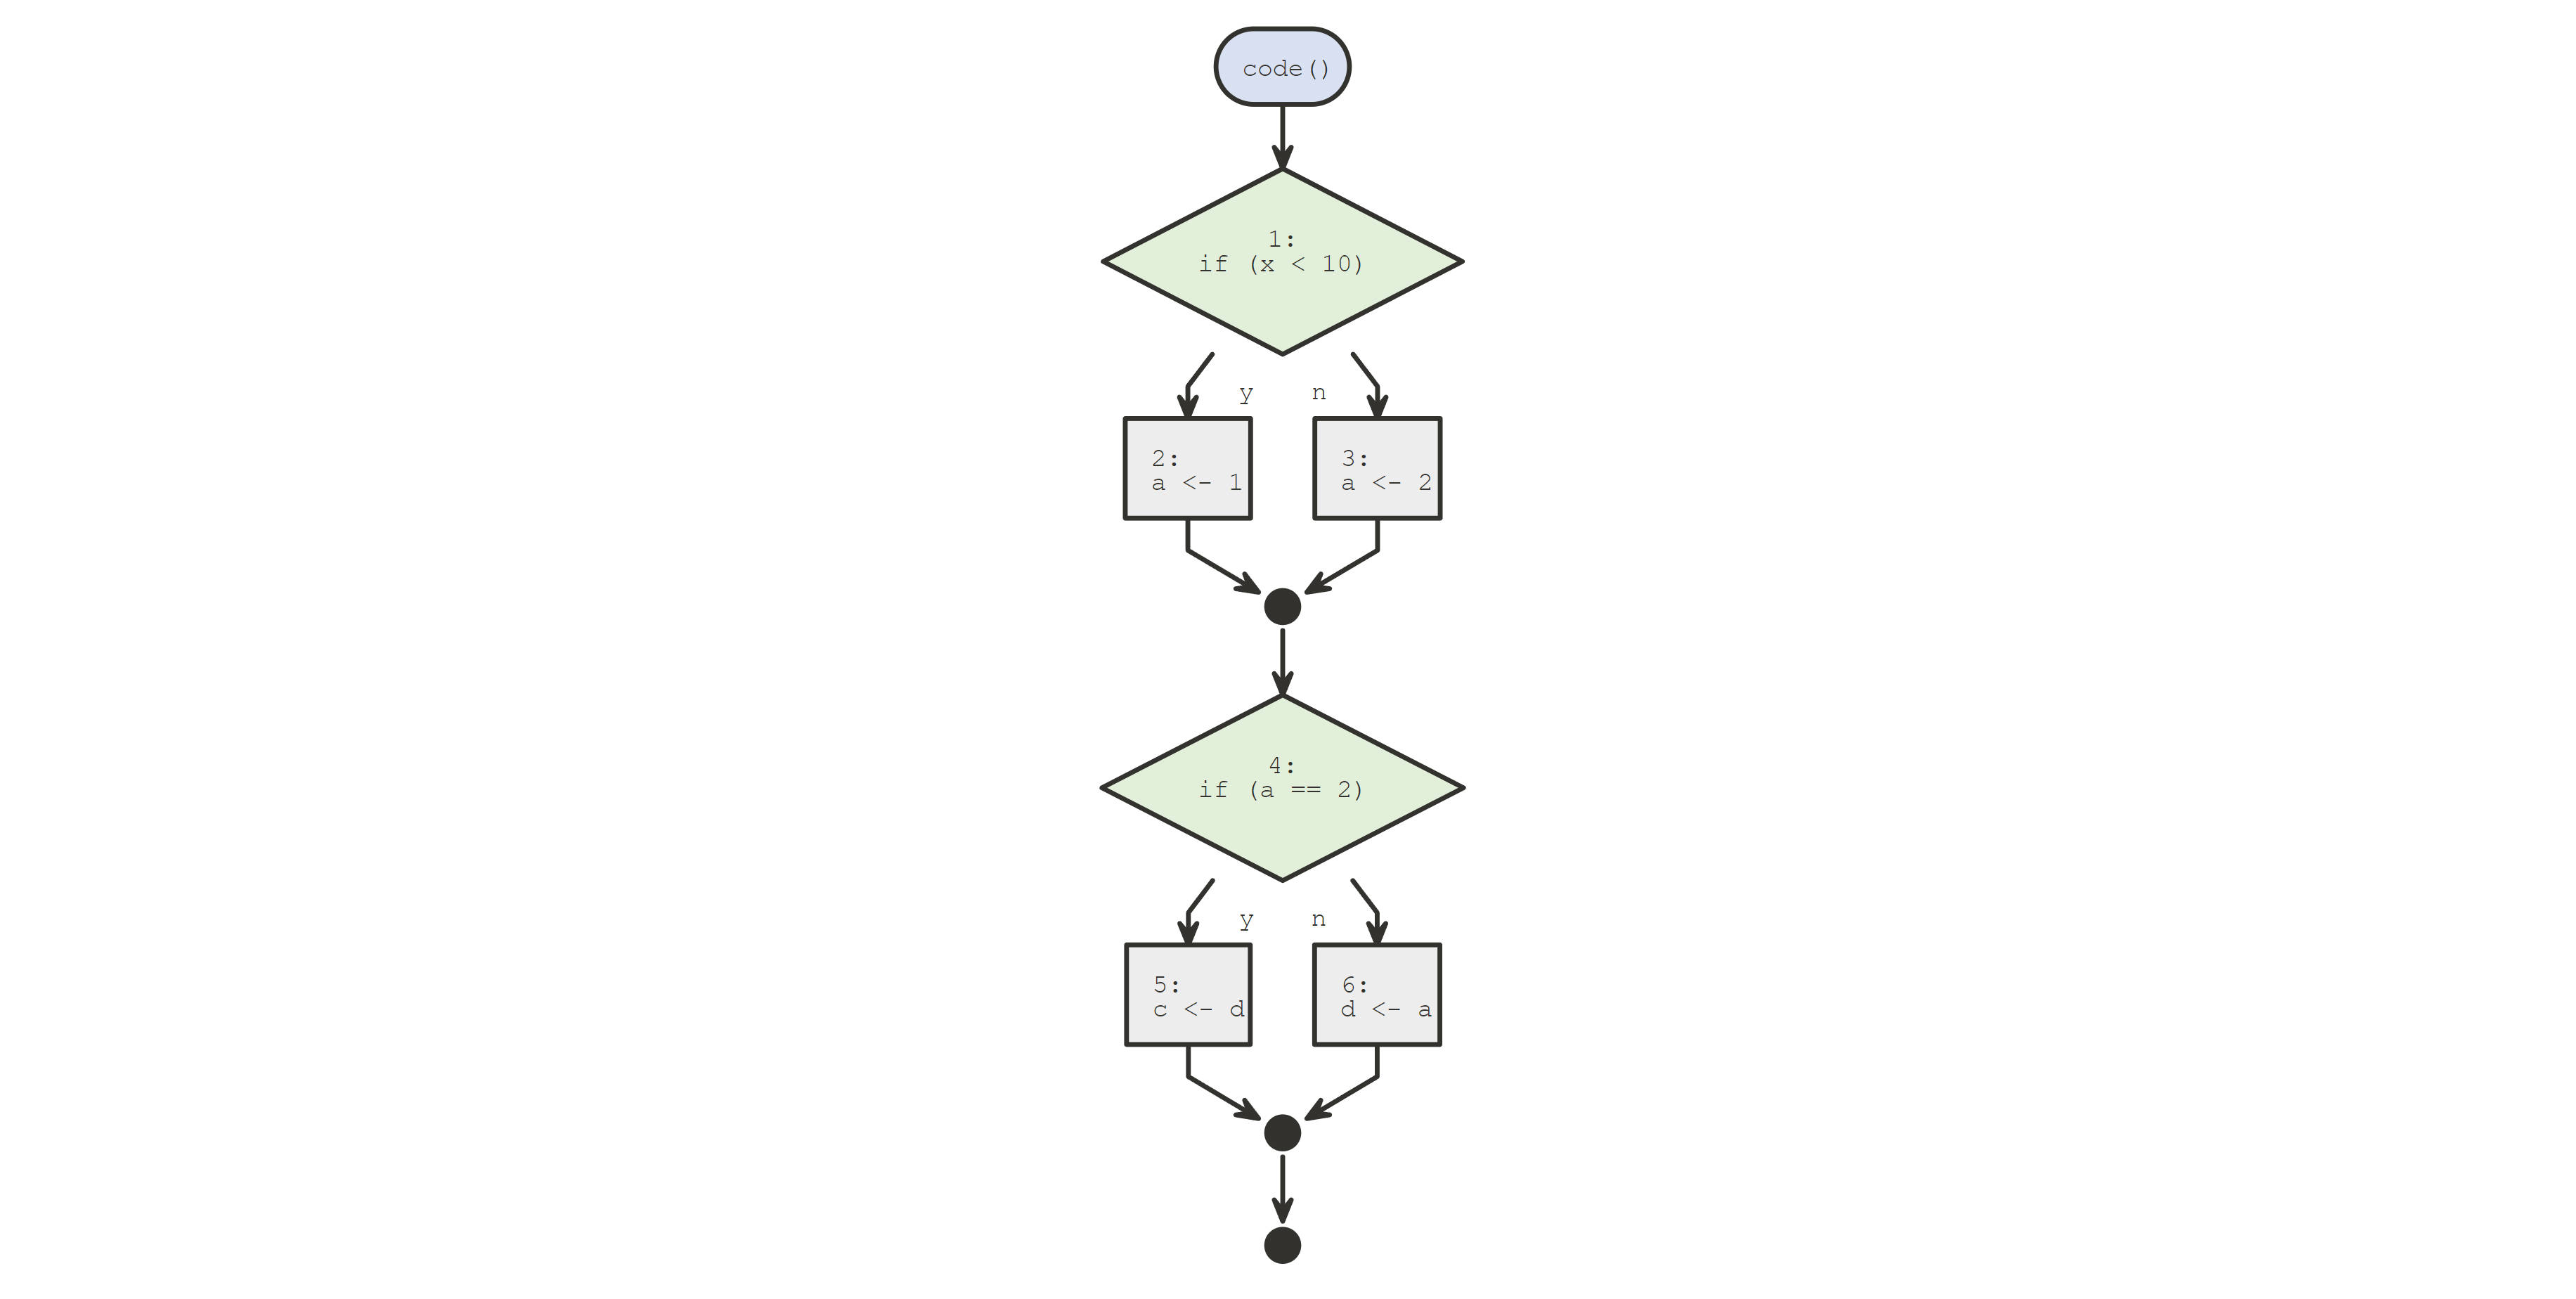
The graph shows that if the variable x<10, a =1, if the variable x>10, a = 2;If a is equal to 2, then c is equal to d, if a is not equal to 2, then d is equal to a.