# Install packages
if (!requireNamespace("grafify", quietly = TRUE)) {
  install.packages("grafify")
}

# Load packages
library(grafify)QQ Plot
Note
Hiplot website
This page is the tutorial for source code version of the Hiplot QQ Plot plugin. You can also use the Hiplot website to achieve no code ploting. For more information please see the following link:
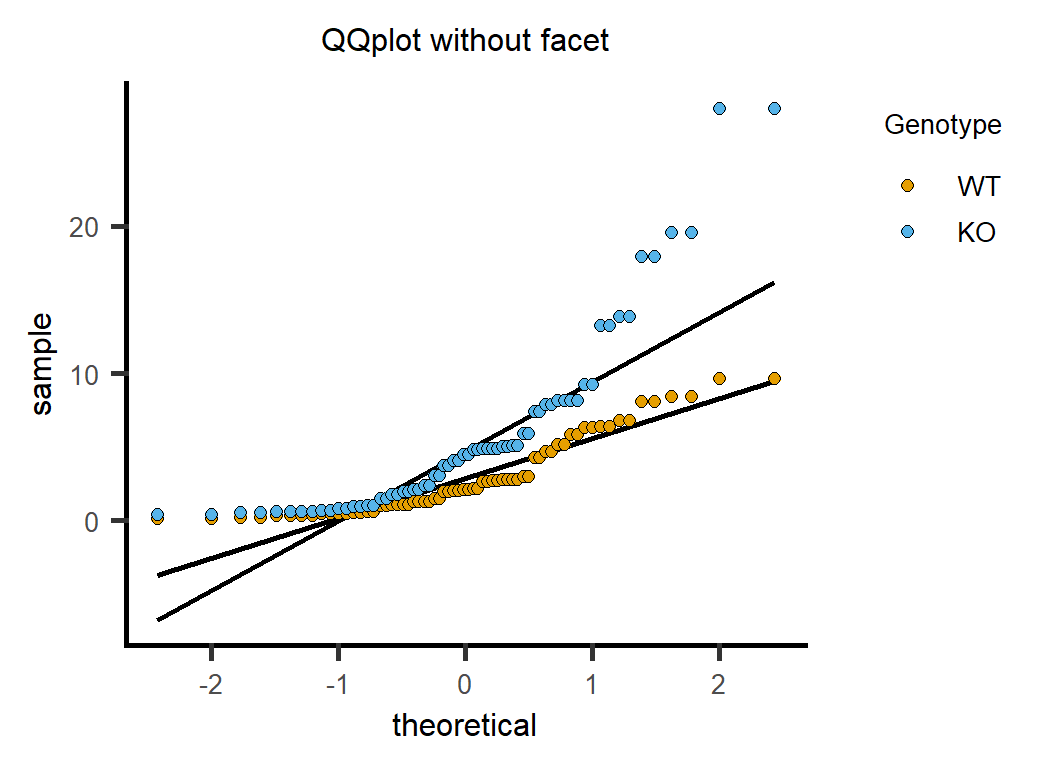
Verify whether a set of data comes from a certain distribution or whether two sets of data come from the same (family) distribution.
Setup
System Requirements: Cross-platform (Linux/MacOS/Windows)
Programming language: R
Dependent packages:
grafify
Data Preparation
# Load data
data <- read.delim("files/Hiplot/148-qqplot-data.txt", header = T)

# Convert data structure
data[, "Genotype"] <- factor(data[, "Genotype"], levels = unique(data[, "Genotype"]))

# View data
head(data)
Genotype Cytokine Experiment facet
1 WT 1.312322 Exp_ 1 A
2 WT 2.171466 Exp_ 2 A
3 WT 1.497610 Exp_ 3 A
4 WT 1.088861 Exp_ 4 A
5 WT 1.270528 Exp_ 5 A
6 WT 3.012708 Exp_ 6 AVisualization
# QQ Plot
p <- plot_qqline(data = data, ycol = Cytokine, group = Genotype,
                 symsize = 2, symthick = 0.5, s_alpha = 1) +
  ggtitle("QQplot without facet") +
  xlab("theoretical") + ylab("sample") +
  guides(fill = guide_legend(title = "Genotype")) +
  scale_color_manual(values = c("#E69F00","#4DB1DC")) +
  theme(text = element_text(family = "Arial"),
        plot.title = element_text(size = 12,hjust = 0.5),
        axis.title = element_text(size = 12),
        axis.text = element_text(size = 10),
        axis.text.x = element_text(angle = 0, hjust = 0.5,vjust = 1),
        legend.position = "right",
        legend.direction = "vertical",
        legend.title = element_text(size = 10),
        legend.text = element_text(size = 10))

p